
All 50 states and Washington DC, ranked from least to most average

51. Washington, DC


What's average: The 90.2% of residents of DC with at least a high school diploma was very close to the average share among the states and DC of 89.5%.
What's not average: The nation's capital is demographically and economically very different from the rest of the country, largely because it's a city with no suburban or rural areas. For example, DC's median age of 34.0 years is much lower than the average of 38.4 years, and its median household income of $82,372 was the highest in the country.
50. Hawaii

What's average: About 92.1% of households in Hawaii have access to at least one car, right in line with the average rate of 92.2% among the states and DC.
What's not average: Hawaii's median home value of $617,400 was the highest in the country, and, perhaps not surprisingly, the 9.3% of Hawaii residents who self-identified as Native Hawaiian or other Pacific Islander was by far the largest share among the states and DC.
49. California

What's average: California's poverty rate of 13.3% was just above the average rate of 13.1% among the 50 states and DC.
What's not average: California's median gross monthly apartment rent of $1,447 was the third-highest in the country. Only 83.3% of California residents had at least a high school diploma, the lowest rate among the states and DC.
48. Alaska

What's average: About 15.9% of Alaska households spoke a language other than English at home, close to the average rate of 15.0% among the 50 states and DC.
What's not average: Unsurprisingly, 14.2% of Alaskans identify as Alaska Native or American Indian, by far the highest rate in the country.
47. New York

What's average: New York's unemployment rate of 4.0% was just above the average rate of 3.8% among the states and DC.
What's not average: New York's average commute to work of 33.7 minutes was the highest in the country. Relatedly, 29.3% of New Yorkers do not have a car in their household, far above the average rate of 7.8% among the states and DC.
46. West Virginia

What's average: The male marriage rate of 49.7% and female rate of 48.2% in West Virginia were both close to the average rates among the 50 states and DC of 49.5% and 47.2%, respectively.
What's not average: West Virginia's GDP per capita of $42,816 was the third-lowest in the country.
45. Mississippi

What's average: About 54 in 1,000 women in Mississippi had a child in the last year, matching the average rate among the 50 states and DC.
What's not average: About 37.9% of Mississippians identify as non-Hispanic black alone, the second-highest share in the country after Washington, DC.
44. Utah

What's average: The median monthly housing cost for homeowners with a mortgage was $1,467 in Utah, just below the average of $1,497 among the states and DC.
What's not average: The average household size in Utah was 3.13 people, the highest in the country. Relatedly, 36.9% of Utah households were families with children, also the highest share in the country.
43. New Jersey
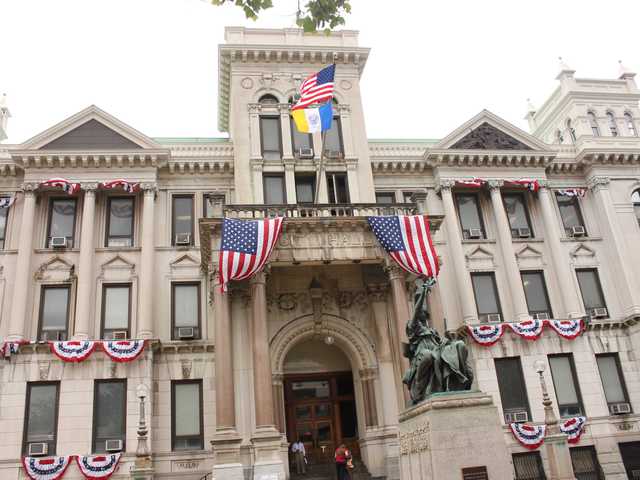
What's average: The 92.3% share of New Jersey residents with health insurance was just above the average share among the 50 states and DC of 91.9%.
What's not average: Only 4.6% of New Jerseyans are military veterans, the second-lowest rate in the country.
42. New Mexico

What's average: About 9.4% of New Mexicans were born outside the US, just below the average share of 9.5% among the states and DC.
What's not average: About 33% of New Mexico households speak a language other than English at home, more than double the average rate of 15%.
41. Massachusetts

What's average: Massachusetts' total population of about 6.9 million was close to the average state population of 6.4 million.
What's not average: About 43.4% of Massachusetts residents had at least a bachelor's degree, the second-highest rate among the states and DC.
40. North Dakota

What's average: North Dakota's median household income of $61,843 was just above the average of $60,235 among the states and DC.
What's not average: About 51.4% of North Dakota residents were male, the second-highest rate in the country.
39. Texas

What's average: Texas' GDP per capita of $62,026 was just above the average among the states and DC of $61,816.
What's not average: About 39.4% of Texans identify as Hispanic or Latino, the second-highest share in the country.
38. New Hampshire

What's average: About 85.2% of New Hampshire residents lived in the same house as the did the previous year, exactly matching the average rate among the states and DC.
What's not average: New Hampshire had the second-highest rate of high-speed internet access in the country, with 88.4% of households having a broadband connection.
37. Louisiana

What's average: About 26.4% of households in Louisiana are families with children, just below the average share of 26.7% among the states and DC.
What's not average: Only 44.5% of male Louisanans are married, the third-lowest rate in the country, and just 41.2% of Louisiana women are married, the second-lowest rate.
36. Vermont

What's average: Vermont's median gross monthly apartment rent of $950 was just below the average among the 50 states and DC of $967.
What's not average: A whopping 23.5% of housing units in Vermont were vacant, the second-highest rate in the country.
35. South Dakota

What's average: South Dakota's poverty rate of 13.0% was just below the average rate of 13.1% among the states and DC.
What's not average: About 8.6% of South Dakota residents identify as non-Hispanic Alaska Native or American Indian alone, the third-highest rate in the country.
34. Maine

What's average: About 18.8% of housing units in Maine were built since 2000, close to the average rate of 19.8% among the 50 states and DC.
What's not average: Maine residents' median age of 44.6 was the highest in the country.
33. Maryland

What's average: About 89.9% of Maryland residents have a high school degree or higher, just above the average rate of 89.5% among the states and DC.
What's not average: Only 51.2% of housing units in Maryland are single-family detached houses, the third-lowest share in the country.
32. Oklahoma

What's average: The average household in Oklahoma has 2.6 people, equal to the average among the states and DC.
What's not average: About 6.8% of Oklahoma residents self-identified as two or more races, the third-highest share in the country.
31. Florida

What's average: The median home value in Florida of $214,000 was close to the average of $233,067 among the 50 states and DC.
What's not average: About 20.9% of Floridians were born outside the US, the fourth-highest share in the country.
30. Wyoming

What's average: Wyoming's median household income of $60,434 was just above the average among the states and DC of $60,235.
What's not average: The mean commute to work in Wyoming of 17.6 minutes was the third-shortest in the country.
29. Montana

What's average: Montana's unemployment rate of 3.7% was just below the average rate of 3.8% among the 50 states and DC.
What's not average: About 10.6% of Montana residents were veterans, tied for the second-highest share in the country.
28. Idaho

What's average: Idaho's poverty rate of 12.8% was just below the average rate of 13.1% among the states and DC.
What's not average: About 74.9% of housing units in Idaho were single-family detached houses, the highest share in the country.
27. Arkansas

What's average: Arkansas' median age of 38.1 was just below the average among the states and DC of 38.4.
What's not average: About 18% of Arkansas residents had at least one disability, the second-highest rate in the country.
26. Alabama

What's average: About 65.5% of Alabama residents identified as non-Hispanic white alone, just below the average share among the states and DC of 68.1%.
What's not average: Just 86.1% of Alabama households had a computer, the fourth-lowest share in the country.
25. Connecticut

What's average: About 26.6% of Connecticut households were families with children, very close to the average share among the states and DC of 26.7%.
What's not average: Only 9.1% of housing units in Connecticut have been built since 2000, the third-lowest share in the country.
24. Nevada

What's average: Nevada's poverty rate of 13.0% was just below the average rate among the states and DC of 13.1%.
What's not average: About 33.1% of housing units in Nevada have been built since 2000, the highest share in the country.
23. Iowa

What's average: About 14.6% of Iowa households moved within the last year, just below the average share among the states and DC of 14.8%.
What's not average: Iowa's unemployment rate of 2.4% was the second-lowest in the country.
22. Kentucky

What's average: About 49.3% of Kentucky residents were male, just below the average share of 49.4% among the states and DC.
What's not average: Kentucky's poverty rate of 17.2% was the fifth-highest in the country.
21. Washington

What's average: About 63.2% of housing units in Washington were single-family detached homes, very close to the average share among the states and DC of 63.1%.
What's not average: About 8.5% of Washington residents identify as non-Hispanic Asian alone, the fifth-highest share in the country.
20. Rhode Island

What's average: Rhode Island's median gross monthly apartment rent of $941 was slightly below the average among the states and DC of $967.
What's not average: Just 7.9% of housing units in Rhode Island have been built since 2000, the lowest share in the country.
19. Nebraska

What's average: Nebraska's median household income of $59,970 was just below the average of $60,235 among the states and DC.
What's not average: About 68 in every 1,000 women in Nebraska had a child in the last year, the second-highest fertility rate in the country.
18. Colorado
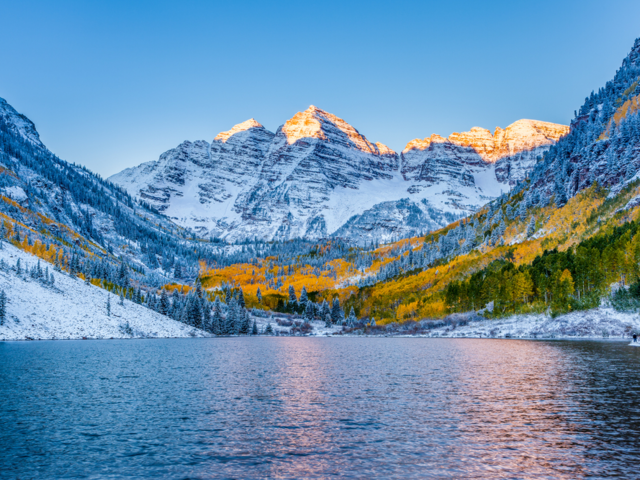
What's average: The average household in Colorado has 2.57 people, just below the average among the states and DC of 2.60 people.
What's not average: About 41.2% of Colorodans have at least a bachelor's degree, the third-highest rate in the country.
17. South Carolina

What's average: The average commute to work takes 24.6 minutes in South Carolina, just below the average among the states and DC of 24.7 minutes.
What's not average: About 26.8% of South Carolina residents identify as non-Hispanic black alone, the sixth-highest share in the country.
16. Arizona

What's average: The median home value of $223,400 in Arizona was just above the average among the states and DC of $223,067.
What's not average: About 30.7% of housing units in Arizona have been built since 2000, the second-highest share in the country.
15. Delaware

What's average: About 31.5% of Delaware residents have at least a bachelor's degree, just below the average share among the states and DC of 31.6%.
What's not average: Just 48.4% of Delawareans are male, the second-lowest percentage in the country.
14. Minnesota

What's average: The median monthly housing cost for homeowners with a mortgage was $1,500 in Minnesota, about the same as the average among the states and DC of $1,497.
What's not average: Minnesota had the highest share of high-school graduates in the country, with 93.1% of residents having at least a high-school diploma.
13. Tennessee

What's average: The median Tennessee resident was 38.6 years old, close to the average of 38.4 years among the states and DC.
What's not average: Just 5.5% of Tennessee households didn't have a car, a bit below the average share of 7.8%.
12. Virginia

What's average: Virginia's per capita GDP of $62,916 was just above the average of $61,816 among the states and DC.
What's not average: About 10.6% of Virginians were veterans, tied for the second-highest share in the country.
11. Kansas

What's average: About 90.7% of Kansas households had a computer, just above the average share among the states and DC of 90.4%.
What's not average: The average commute to work took 19.1 minutes, the sixth-lowest in the country.
10. Georgia

What's average: About 85.1% of Georgians lived in the same house as they did a year ago, just below the average share of 85.2% among the states and DC.
What's not average: About 31.1% of Georgians identified as non-Hispanic black alone, the fourth-highest share in the country.
9. Ohio

What's average: About 90.3% of Ohio residents had at least a high school diploma, just above the average share among the states and DC of 89.5%.
What's not average: About 12.5% of housing units in Ohio have been built since 2000, the eighth-lowest share in the country.
8. Pennsylvania

What's average: Pennsylvania's median household income of $59,195 was just below the average of $60,235 among the states and DC.
What's not average: About 11.2% of Pennsylvania households did not have a car, the fourth-highest share in the country.
7. Illinois

What's average: Illinois' median gross monthly apartment rent of $974 was just above the average of $967 among the states and DC.
What's not average: Illinois' population of 12.8 million makes it the sixth-largest state.
6. Wisconsin

What's average: Wisconsin's median household income of $59,305 was just below the average of $60,235 among the states and DC.
What's not average: Wisconsin's average household size of 2.40 people was tied for fourth-lowest in the country.
5. Indiana

What's average: About 91.8% of Indiana residents had health insurance, just below the average share among the states and DC of 91.9%.
What's not average: About 73.0% of housing units in Indiana were single-family detached homes, the third-highest share in the country.
4. Michigan
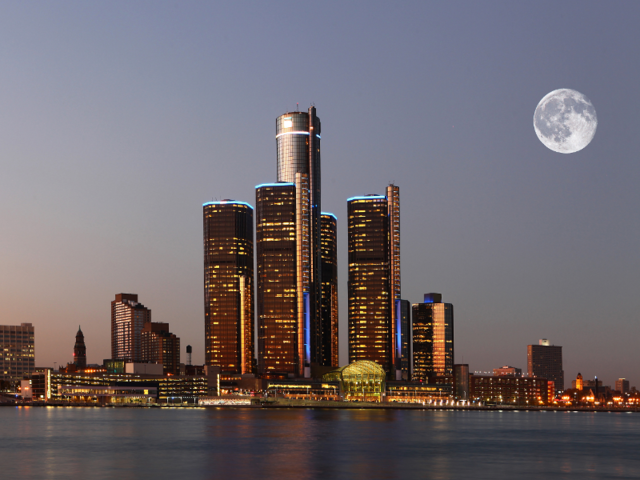
What's average: About 49.2% of Michigan men and 46.8% of women were married, close to the average rates among the states and DC of 49.5% of men and 47.2% of women.
What's not average: About 11.9% of housing units in Michigan have been built since 2000, the sixth-lowest share in the country.
3. Missouri
What's average: About 89.7% of Missouri residents had at least a high school diploma, just above the average share among the states and DC of 89.5%.
What's not average: Only 6.2% of Missouri households spoke a language other than English at home, the ninth-lowest rate in the country.
2. North Carolina

What's average: About 31.3% of North Carolina residents had at least a bachelor's degree, just below the average share among the states and DC of 31.6%.
What's not average: About 21.2% of North Carolinians identified as non-Hispanic black alone, the ninth-highest share in the country.
1. Oregon

What's average: Oregon's unemployment rate of 3.8% matched the average rate among the states and DC.
What's not average: Only 9.3% of Oregon's housing units were vacant, the third-lowest share in the country.
 Next Story
 I spent $2,000 for 7 nights in a 179-square-foot room on one of the world's largest cruise ships. Take a look inside my cabin.
 Colon cancer rates are rising in young people. If you have two symptoms you should get a colonoscopy, a GI oncologist says.
 Saudi Arabia wants China to help fund its struggling $500 billion Neom megaproject. Investors may not be too excited.
 Catan adds climate change to the latest edition of the world-famous board game
 Tired of blatant misinformation in the media? This video game can help you and your family fight fake news!
 Tired of blatant misinformation in the media? This video game can help you and your family fight fake news!
 JNK India IPO allotment – How to check allotment, GMP, listing date and more
 Indian Army unveils selfie point at Hombotingla Pass ahead of 25th anniversary of Kargil Vijay Diwas
- JNK India IPO allotment date
- JioCinema New Plans
- Realme Narzo 70 Launched
- Apple Let Loose event
- Elon Musk Apology
- RIL cash flows
- Charlie Munger
- Feedbank IPO allotment
- Tata IPO allotment
- Most generous retirement plans
- Broadcom lays off
- Cibil Score vs Cibil Report
- Birla and Bajaj in top Richest
- Nestle Sept 2023 report
- India Equity Market
