
Here's how every state's economy is doing in 2019, ranked from worst to best
Advertisement


51. Mississippi's per capita GDP of $39,037 and average weekly wage of $729 were the lowest among the 50 states and DC, while its unemployment rate of 5.0% was the third highest.


50. Michigan's job growth rate of 0.4% was the seventh lowest in the country and its unemployment rate of 4.2% was tied for tenth highest.

Advertisement
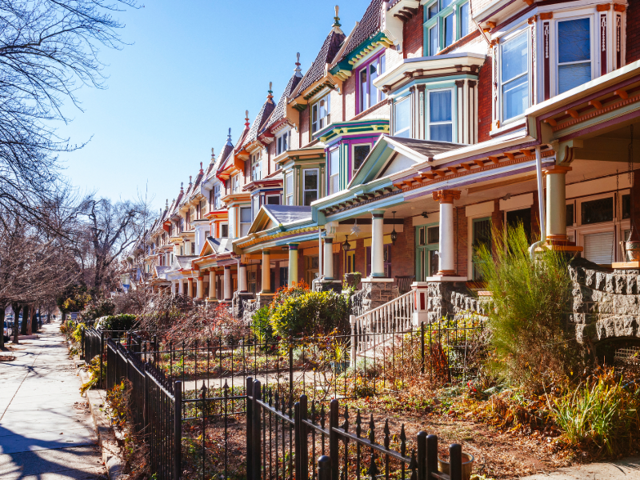
49. Maryland's GDP growth rate of 1.8% was the third lowest among the states and DC, and its job growth rate of 0.1% was the second lowest.
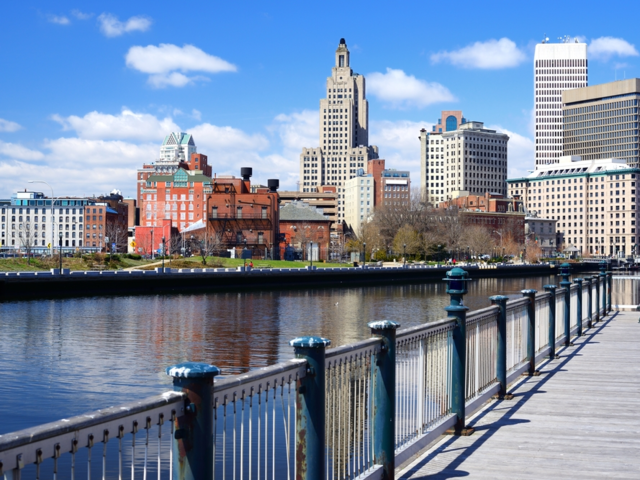
48. Rhode Island's wage growth rate of 1.0% was the lowest in the country, and its GDP growth rate of 2.2% was the sixth lowest.
Advertisement
47. Kentucky's per capita GDP of $47,738 was the eighth lowest among the states and DC, and its average weekly wage of $806 was the sixth lowest.

46. Louisiana's unemployment rate of 4.3% was tied for eighth highest in the country. Louisiana was the only state with negative job growth between June 2018 and June 2019, with a decline of 0.1% in non-farm payroll jobs.

Advertisement
45. North Carolina's unemployment rate of 4.1% was tied for twelfth highest in the country, and its average weekly wage growth rate of 1.9% was the fourth lowest.

44. Pennsylvania's wage growth rate of 2.3% was the sixth lowest in the country. Its GDP per capita of $63,193 was very close to the average of $63,182 among the states and DC.

Advertisement
43. Ohio's wage growth rate of 2.5% between June 2018 and June 2019 was the eighth lowest among the states and DC, and its non-farm payroll job growth rate of 0.5% over that same year was the ninth lowest.

42. Wisconsin's unemployment rate of 2.9% was tied for eighth lowest in the country, but its wage growth rate of 1.4% between June 2018 and June 2019 was the second worst.

Advertisement
41. Maine's GDP per capita of $49,329 was the tenth lowest among the states and DC, while its average weekly wage of $841 was eighth lowest.

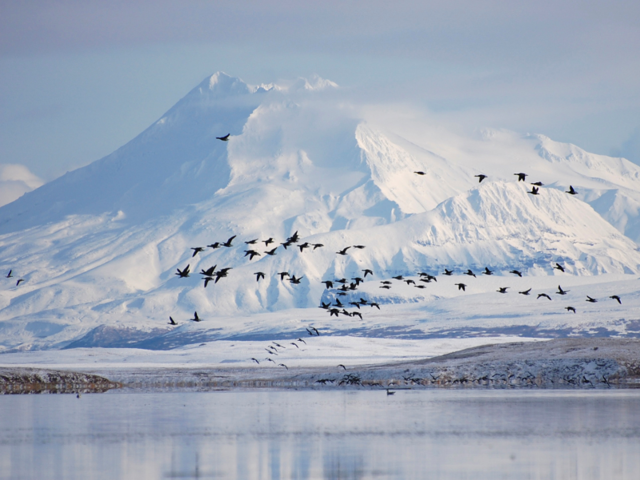
40. Alaska's GDP growth rate of 3.9% was tied for sixth best in the country, but its unemployment rate of 6.4% was the worst among the states and DC.
Advertisement
39. Hawaii's GDP growth rate of 1.2% was the lowest among the states and DC, but its unemployment rate of 2.8% was tied for fifth best.

38. Montana's GDP per capita of $47,103 and its average weekly wage of $826 were both the seventh lowest among the states and DC.

Advertisement
37. South Carolina's average weekly wage of $850 was the ninth lowest in the country, and its per-capita GDP of $46,567 was the sixth lowest.

36. Missouri's GDP growth rate of 2.3% was tied for eighth lowest in the country. Its unemployment rate of 3.3% was lower than the average rate of 3.6% among the states and DC.

Advertisement
35. Arkansas' wage growth rate of 7.4% between June 2018 and June 2019 was the sixth highest among the states and DC, while its per capita GDP of $43,400 was the second lowest.

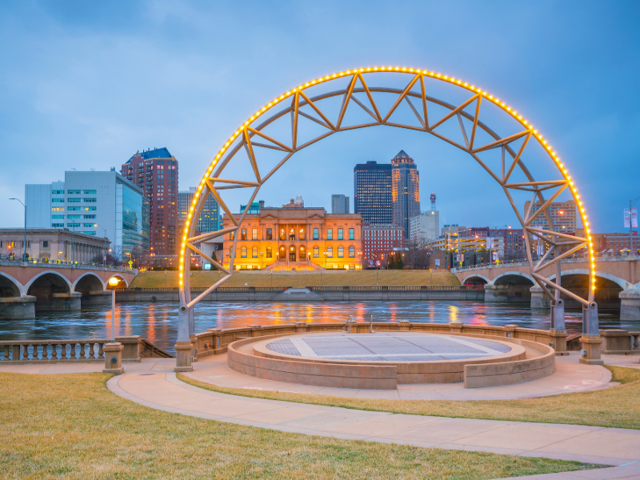
34. Iowa's unemployment rate of 2.4% was the third best in the country, but its GDP growth rate of 2.3% was tied for eighth lowest.
Advertisement
33. Tennessee's GDP growth rate of 2.4% was the tenth lowest in the country, but its non-farm payroll job growth rate of 1.7% between June 2018 and June 2019 was above the average rate among the states and DC of 1.3%

32. Indiana's unemployment rate of 3.5% was a bit better than the average rate among the states and DC of 3.6%, while its per capita GDP of $55,988 was a bit lower than the average of $63,182.

Advertisement
31. Georgia's wage growth rate of 2.1% was the fifth lowest in the country, but its GDP growth rate of 3.1% was a little higher than the average rate of 3.0% among the states and DC.

30. Idaho's job growth rate of 2.3% between June 2018 and June 2019 was the eighth highest in the country, but its per capita GDP of $45,320 was the fourth lowest.

Advertisement
29. New Hampshire's unemployment rate of 2.5% was the fourth best among the states and DC, but its wage growth rate of 1.6% between June 2018 and June 2019 was the third worst.

28. Connecticut's per capita GDP of $78,933 and average weekly wage of $1,111 were both the fifth highest in the country.

Advertisement
27. New Jersey's average weekly wage of $1,039 was the seventh highest in the country but its GDP growth rate of 1.8% was tied for third lowest.

26. Vermont's unemployment rate of 2.1% was the lowest among the states and DC, but its wage growth rate of 2.8% between June 2018 and June 2019 was the ninth worst.

Advertisement
25. Alabama's per capita GDP of $46,366 was the fifth lowest among the states and DC, but its job growth rate of 1.9% was higher than the average rate of 1.3%.

24. Minnesota's average weekly wage of $1,032 was the ninth highest in the country, but its non-farm payroll job growth rate of 0.3% between June 2018 and June 2019 was the fifth lowest.

Advertisement
23. Illinois' unemployment rate of 4.3% was tied for eighth highest in the country, but its per capita GDP of $69,714 was above the average of $63,182 among the states and DC.

22. New Mexico's GDP growth rate of 4.6% was the third highest among the states and DC, but its average weekly wage of $778 was the second lowest.

Advertisement
21. Florida's job growth rate of 2.5% was the seventh highest in the country, but its per capita GDP of $50,362 was below the average of $63,182 among the states and DC.
20. Nebraska's job growth rate of 0.5% was the tenth lowest in the country, but its unemployment rate of 3.0% was below the average rate among the states and DC of 3.6%.

Advertisement
19. Arizona's job growth rate of 2.8% was the second best in the country, but its unemployment rate of 4.9% was tied for fourth worst.

18. Kansas' wage growth rate of 8.0% was the fifth best in the country, an its GDP growth rate of 3.1% was a bit above the average rate of 3.0% among the states and DC.

Advertisement
17. Oklahoma's GDP growth rate of 3.9% was tied for sixth highest in the country, and the state's wage growth rate of 6.7% was ninth highest.
16. Oregon's job growth rate of 1.9% was the twelfth highest in the country, but its unemployment rate of 4.1% was higher than the average rate among the states and DC of 3.6%.

Advertisement
15. Virginia's unemployment rate of 2.9% was tied for eighth lowest in the country, and its average weekly wage of $1,026 was the eleventh highest.

14. West Virginia's GDP growth rate of 5.2% was the best in the country, but its unemployment rate of 4.7% was the sixth worst.

Advertisement
13. Delaware's per capita GDP of $79,700 was the fourth highest in the country, and its GDP growth rate of 3.9% was the sixth highest.

12. South Dakota's job growth rate of 2.6% was the fifth highest among the states and DC, and its unemployment rate of 2.9% was tied for eighth lowest.

Advertisement
11. Massachusetts' per capita GDP of $84,281 and average weekly wage of $1,136 were both the third highest in the country.

10. New York's per capita GDP of $88,055 was the second highest in the country, and its average weekly wage of $1,068 was the sixth highest.

Advertisement
9. California's average weekly wage of $1,131 was the fourth best among the states and DC, but its unemployment rate of 4.2% was tied for tenth worst.
8. North Dakota's GDP growth rate of 3.9% was tied for sixth highest in the country, and its unemployment rate of 2.3% was the second lowest.
Advertisement
7. Wyoming's wage growth rate of 8.7% was the second highest among the states and DC, and its job growth rate of 2.0% was the ninth highest.

6. Washington's job growth rate of 2.7% was the third highest in the country, and its average weekly wage of $1,192 was the second highest.

Advertisement
5. Texas' GDP growth rate of 5.1% was the second highest in the country, and its job growth rate of 2.5% was the sixth highest.

4. Nevada's job growth rate of 3.3% was the highest among the states and DC, and its GDP growth rate of 4.0% was the fifth highest.

Advertisement
3. Colorado's average weekly wage of $1,037 was the eighth highest in the country, and its job growth rate of 1.9% was the tenth highest.

2. Utah's GDP growth rate of 4.2% was the fourth highest in the country, and its unemployment rate of 2.8% was tied for fifth lowest.

Advertisement
1. DC's per capita GDP of $205,068 and average weekly wage of $1,683 were by far the highest in the country, but its unemployment rate of 5.6% was the second worst.
 Next Story
Advertisement
 Saudi Arabia wants China to help fund its struggling $500 billion Neom megaproject. Investors may not be too excited.
 I spent $2,000 for 7 nights in a 179-square-foot room on one of the world's largest cruise ships. Take a look inside my cabin.
 One of the world's only 5-star airlines seems to be considering asking business-class passengers to bring their own cutlery
 Experts warn of rising temperatures in Bengaluru as Phase 2 of Lok Sabha elections draws near
 Axis Bank posts net profit of ₹7,129 cr in March quarter
 7 Best tourist places to visit in Rishikesh in 2024
 From underdog to Bill Gates-sponsored superfood: Have millets finally managed to make a comeback?
 7 Things to do on your next trip to Rishikesh
