
Paul Krugman, Rick Rieder, and 47 more of the brightest minds on Wall Street reveal the most important charts in the world


Gary Shilling: There's a "two-thirds probability" of a recession this year.


"The Fed's earlier belief in the Phillips Curve has been challenged by reality. Despite the plunge in the headline unemployment rate from 10% to 3.9% in December, inflation remains below the central bank’s 2% target. Globalization, declining unionization, robots, Amazon, Uber, government pressure on drug costs, the competitive race to zero in financial fees, the strong dollar and consumer and business resistance to price hikes are all at work.
The likelihood of a recession starting this year, which I rate at two-thirds probability, is also deflationary. That would end and reverse the Fed credit tightening campaign that started in December 2015."
Marko Kolanovic: Stock-market liquidity and volatility have an increasingly dangerous relationship.

"There’s a strong and non-linear relationship between S&P 500 futures market depth (a measure of liquidity) and volatility – market depth declines exponentially as the VIX rises, and this relationship has been getting stronger in recent years. An increase in volatility also typically results in selling by systematic investors, as many of these strategies effectively embed a 'stop-loss.'
Given this systematic selling happens in an environment of reduced liquidity, it causes their flows to have an outsized price impact. This liquidity-volatility-flows feedback loop creates market fragility and increases the risk of tail events."
Written with Bram Kaplan, senior analyst on the Global Quantitative and Derivatives Strategy team.
David Rosenberg: "We have as much as an 80% chance of a recession."

"Global liquidity conditions have tightened dramatically on the back of either tighter or less accommodative central bank policies. This will hit the world economy with a lag, and history suggests we have as much as an 80% chance of a recession as a result of this tourniquet."
Rick Rieder: The Fed is doing the appropriate thing.

"Between the lines of the Fed’s mandate is the need to keep borrowing costs for consumers and enterprises in-line with potential growth: if rates are too low (the return on capital is too high relative to the cost of capital), credit bubbles can form, but if rates are too high (the return on capital is too low relative to the cost of capital) constrained credit can weigh on economic activity.
Today, we see credit yields as roughly neutral relative to potential growth; hence, we believe interest rate policy has normalized and the Fed policy rate pause we long argued for should support sound economic growth and healthy financial markets. Still, while increased rates could threaten economic activity at this stage, and the Fed should remain patient and cautious, a policy rate hike later in 2019 isn’t off the table if economic data improves."
Paul Krugman: Here's why America is so divided right now.

"Things have been falling apart on multiple fronts since the 1970s: Political polarization has marched side by side with economic polarization, as income inequality has soared," Krugman said in a New York Times column last year.
He continued: "And both political and economic polarization have a strong geographic dimension. On the economic side, some parts of America, mainly big coastal cities, have been getting much richer, but other parts have been left behind. On the political side, the thriving regions by and large voted for Hillary Clinton, while the lagging regions voted for Donald Trump."
Byron Wien: 'America First' has big implications for investors.

"After the Social Security Administration and the Federal Reserve, China and Japan are the biggest holders of US Treasurys. We know that US America First trade policies have caused serious concern in these countries. If Japan and China buy fewer US government securities when we are borrowing more than ever, the impact could be significant."
Liz Ann Sonders: This usually forebodes a recession.

"Consumer confidence has rolled over, with a notable drop in the expectations component. There is now a near-record spread between present conditions and future expectations. Troughs in this spread have historically represented near-term recession warnings."
Jeff Kleintop: Stocks are saying "welcome to the recession."

"Stock markets around the world seem to be retracing their average late-cycle path.
The current path appears to have priced in the start of a global recession at the end of 2018, as you can see in this chart of the MSCI World Index. This could lead to a bounce since other leading indicators are suggesting the global economic cycle may have a bit longer to run."
Michelle Meyer: American manufacturing is in danger of a slowdown.

"Global manufacturing PMIs have weakened of late after running above the breakeven level for all of last year.
To achieve a cleaner comparison, we look at the standardized level of both the China and US manufacturing PMI. The two series trend closely, showing the linkage between the two economics.
The latest weakening in the data has been particularly acute for China which could portend further softness ahead for the US, akin to the early 2016 episode."
Dubravko Lakos-Bujas: This is one of the biggest sources of stock-market volatility.

"Of the many macro uncertainties that pushed market volatility higher in 2H2018, trade war and monetary policy error have weighed the most.
With [the] Fed turning more dovish and constructive, US-China trade discussion is center-stage and should be watched carefully. A satisfactory resolution of the issue would have positive consequences for global growth and may prolong the current business cycle."
Lori Heinel: Geopolitical risk is surging.

"As the world order continues to transform, geopolitical risk is growing. We’ve seen international organizations, treaties and laws gradually begin to cede influence to the unilateral actions of major countries, driving change based on domestic pressures and global shifts in power dynamics.
A lack of transparency around these unilateral policy decisions by executive administrations is likely to cause more frequent market volatility, as we saw towards the tail end of last year. The increase in economic policy uncertainty presents both opportunities and risks for investors: from the U.S.-China trade dispute to European populist upheaval to Brexit, any resolution or escalation of geopolitical tensions across the globe could have a significant impact on financial markets."
Scott Minerd: US political battles will undermine confidence and increase risk for investors.

"The US political climate has become more polarized under President Trump than at any point in the post-war period, continuing a longstanding trend. This can be seen in the spread between the president's approval rating with his own party relative to opposition party voters.
With the 2020 election looming and voters appearing to prefer confrontation over compromise, bi-partisan efforts will be increasingly difficult, resulting in gridlock. Partisan conflicts will become more acute with Democrats having recently taken control of the House of Representatives, as they now have subpoena power.
Legislative battles over the budget, trade issues, the debt ceiling, and investigations into the Trump administration will undermine confidence present a headwind for markets throughout 2019."
Torsten Slok: More evidence that the cycle is almost over.

"The credit cycle leads the economic cycle and the chart below shows that delinquency rates on consumer loans bottomed in 2017. The key question for investors across all markets is when the ongoing rise in delinquency rates will become a macro problem. This chart is more evidence that we are late cycle."
George Pearkes: Fed business contacts suggest a growth slowdown — but no recession yet.

"While the economy is not likely to enter a recession near-term, leading indicators suggest that the US is experiencing another intra-cycle slowdown of growth similar to 2011 or 2016. Using natural language processing, our Beige Book Index captures the sentiment in each release (twice per quarter) of the Fed's Beige Book, a compilation of qualitative economic data from each Fed district.
As shown in the chart, the correlation between growth and the one quarter lead in sentiment expressed in the Beige Book isn't perfect (R-squared = 0.564) but it does tend to lead changes in near-term growth trend. Given other leading indicators of recession are in good shape, that suggests that the current deceleration in growth will not be the end of the expansion that has been running since 2009."
Tom Lee: 2019 looks a lot like 2009 for stocks.

"So far in 2019, the S&P 500 is tracking similar to prior instances of waterfall declines, particularly when the PMI>50 at time of completion of the 19% decline (within 60 days).
Notably, as shown above, equity markets post 12-month gains of 32% on average in the 12-months after waterfall declines (but PMI>50). 2019 falls into this case."
Sam Bullard: Politics is putting investors and CEOs on high alert.

"Keynes stated that animal spirits are one of the key factors behind fluctuations in the economy and changes in the business cycle. Therefore, a quantitative measure of animal spirits may lead to a more accurate estimation of the potential effect that a change in animal spirits has on the economy.
Animals spirits have fallen considerably, as recent market turmoil and political uncertainty have weighed on expectations for economic growth. Given the broad based weakness, business leaders and investors are likely to remain cautious in the near term."
Note: "Animal spirits" is the term coined by legendary economist John Maynard Keynes to describe instincts, proclivities and emotions that ostensibly influence and guide human behavior.
Steven Wieting: Now is the time to consider emerging markets.

"What this one shows is that there is a greater breath of individual emerging-market country indices that are now in technical uptrends. In other words, they've broken out above their 200-day moving average.
We don't want to argue that growth is strong and accelerating. What we think is that the growth scare and the slowing is in the price, and that financial markets — if they're going to be forward looking — this is the time again where you do want to take advantage of that. As US assets have recovered on this change in tune from the Fed, EM is probably a prime beneficiary of this."
Katie Nixon: Stay the course in risky assets.

"In the US and other global equity markets, there is no relationship between the performance in previous and subsequent quarters, or even from one year to the next. While short-term returns are unpredictable, longer-term (e.g., three to seven years) evidence suggests more predictability due to mean-reversion in risky assets, especially after periods of market stress.
Staying the course with risky assets allows for recovery of lost value and helps earn the higher expected returns with time, which does not happen for investors who exit the market."
Karthik Sankaran: More good news for emerging-market investors.
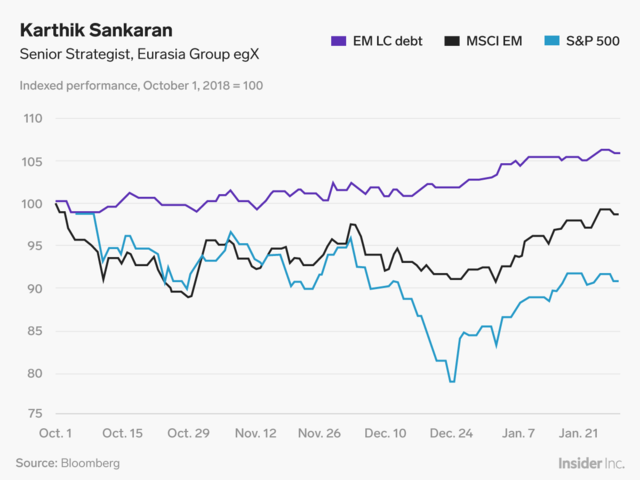
"The continuing narrative from Q4 2018 of synchronized (but non-recessionary) global slowdown driven by trade conflict, fading US fiscal tailwinds and Chinese deleveraging is helping emerging markets local currency debt more than either US or EM equities.
This reflects how a dovish Fed and its impact on USD have become more important for EM currencies and local debt than US growth or import demand. Index composition has also helped, with local currency debt benchmarks giving greater weight to Latin America and Turkey while EM equity benchmarks have a higher weighting for East Asia and technology, the frontlines of the trade war."
Brian Belski: Earnings revisions have plunged — and that's a good contrarian signal.

"We have found through our analysis that FY2 earnings revision ratios are a useful indicator for trying to determine market inflection points. In our work, FY2 earnings revision ratios measure the number of analysts increasing their earnings estimates relative to the total number of analyst revisions over the prior 60 days. Thus, the actual data is somewhat of a diffusion index, with values greater than 50% indicating earnings optimism and values below 50% indicating earnings pessimism.
Based on our analysis, this indicator tends to work best from extremely low values, which we define as a level at or below minus one standard deviation from the mean. As you can see from Exhibit 1, this indicator recently hit this barrier. More important, we found that S&P 500 performance is quite attractive in the months following such “poor” readings.
By contrast, significant losses have been quite rare. In fact, all of the double-digit losses throughout this period occurred during 2002, which was characterized by uncertainty still surrounding the continued Tech bubble unwind, as well as the 9/11 aftermath. Furthermore, we also found that gains in excess of 30% have been more common than significant losses. Therefore, we view recent levels in this indicator as a positive signal for market performance in the coming months.
Chris Harvey: The drought for value stocks is ending.

"After two years of underperformance and a healthy sell-off in 4Q18, we think the risk/reward for the Value style is much more attractive. The pendulum is swinging back in Value's favor —we're expecting a positive run for the investment style over the next 12 months.
Equity valuation spreads (i.e., the difference between cheap' and 'expensive') had been stretched to a historic level, creating opportunity. Year-to-date, the relationship is beginning to revert as the Value style comes back into favor. Tighter credit spreads, a Fed pause and a yield curve that has already flattened are all helping to catalyze the positive shift."
Note: The shaded areas highlight the re-pricing of multiples and when Value came back into favor.
Keith Parker: Stocks usually go up after big declines.
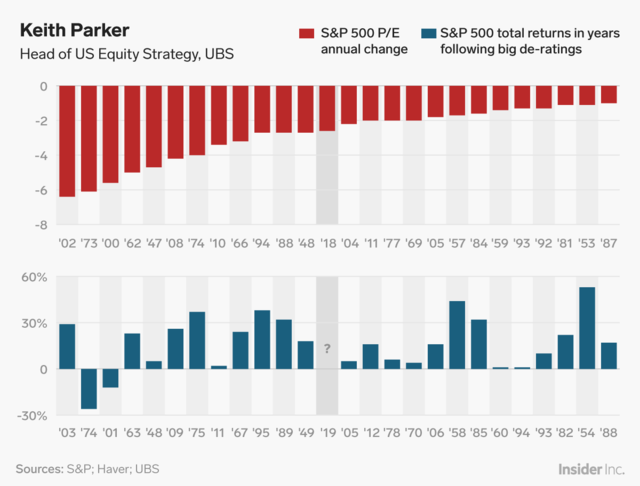
"With a higher risk premium priced by the market, we use history to see how the market has performed following big de-ratings in the S&P 500 P/E multiple.
Interestingly, we find that in years following a decline in the P/E of more than 1x, the S&P 500 has returned an average and median of 16% with only two instances of negative returns (2000-01, 1973-74). There has been a higher percentage of years with 0-5% returns, which have happened 20% of the time. History would suggest that the balance of risks is still to the upside."
Robert Tipp: The Fed has been very responsive to market twists and turns.
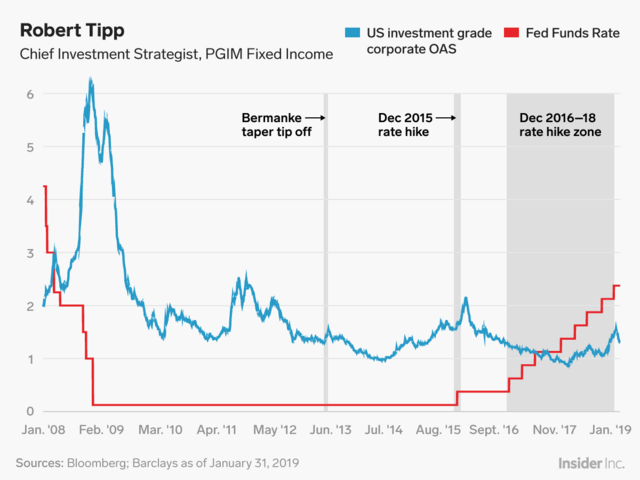
"The advent of the Fed 'collar' has been clear in retrospect over the last several years.
The periods of tightening adjustments — announcing the taper, the first Fed rate hike in 2015, the full speed ahead rate hikes from December 2016 through 2018 — occurred against a backdrop of low to moderate spread levels, and what they referred to as 'elevated' stock market levels.
By contrast, periods of market turbulence have all seen the Fed quickly turn to caution. This was the case with the September 2015 meeting hike skip, as well as with the dovish twists of rhetoric and extended pause over much of 2016, and most recently with the post December 2018 rate hike policy reorientation from hikes to caution."
Lori Calvasina: The Fed's flexibility is good news for stock-market investors.

"Although they’ve clearly gotten less concerned about hikes, equity investors continued to express concern about quantitative tightening in January. The WSJ also reported in January that the Fed was considering ending its balance sheet unwinder earlier than originally expected. And so we’ve spent some time revisiting how quantitative easing impacted the equity market.
Here, we highlight how the S&P 500’s trailing P/E expanded during and following quantitative easing, and how contraction began shortly after quantitative tightening began. Even if this is just a coincidence, ending the balance sheet unwind would give US equity investors one less thing to worry about. Overall, we view valuation as a neutral driver for US equities, as the forward P/E is close to average. We’ve also been highlighting how the trailing P/E contraction that occurred through the Dec. 24th low was a little worse than the average contraction seen over the last 3 tightening cycles."
Lindsey Bell: These stocks will weather a credit crisis.

"Upon a closer look, we found large-cap companies, classified as members of the S&P 500 index, are best positioned to weather a credit-induced storm. Their ability to pay off the debt on the books is much better than it was heading into the financial crisis. From a leverage perspective, the amount of net debt outstanding versus EBITDA, or earnings before interest, taxes, depreciation and amortization, is 1.6x or almost half the rate it was in 2009. Additionally, due to the tax reform policies of 2018, S&P 500 companies have 63% more cash on hand now than they did at the end of 2016.
For small-cap companies, those in the S&P 600 Small Cap index, the opposite is true.
Because smaller business loaded up on debt in the low interest rate environment of the past decade, their ability to pay down debt quickly has eroded. The net debt to EBITDA ratio has more than doubled since 2009, and while they have about 8% more cash than in 2016, the increase won’t be as influential on easing credit concerns for these smaller companies."
Binky Chadha: Wage growth doesn't necessarily hurt company margins.

"Do higher wages mean lower margins? They haven’t historically."
David Bianco: Here's another way to think about inflation.

"Consider normal inflation and interest rates over the past few centuries, not just the past few decades."
Brian Nick: This is the best thing about the jobs market right now.
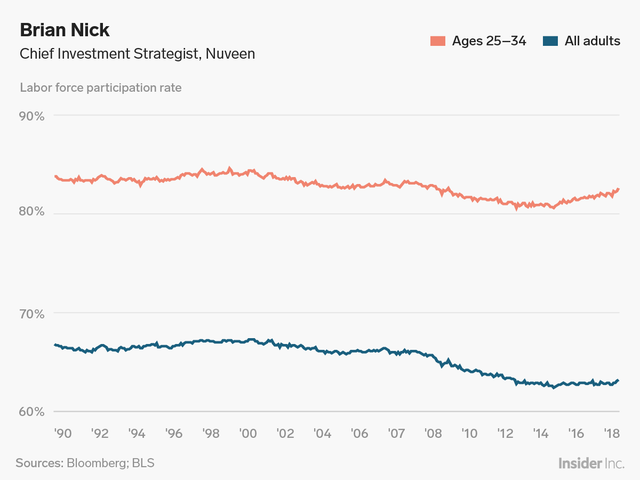
"The most important and encouraging aspect of recent US labor market data has been the increase in labor force participation (LFP), the percentage of adults who are working or actively looking for work. This number had been on a steady downward trajectory since the start of the global financial crisis but stabilized beginning in 2014.
Why? Two countervailing force are at play. First, the abundance of job openings relatively to the number of unemployed workers, along with the rise in wages, has drawn more workers off the sidelines into active employment.
But second, despite the strong cyclical increase in demand for labor, the number of Americans of prime working age (25-54) is shrinking as the Baby Boomers age into retirement. That’s clearly visible on the graph above. The darker line shows that LFP among prime age workers is up to 82.6% from a low of 80.6% in 2015. But the overall LFP — the lighter blue line — has increased by much less over the same period due to demographic trends."
Steve Rattner: Here come trillion-dollar deficits.

"Following a substantial narrowing after the financial crisis, the recent tax cuts and loss of spending restraint in Washington have put the deficit on track to exceed $2 trillion within a decade. This not only has implications for the financial markets, but represents intergenerational theft."
Christophe Barraud: Global trade growth is poised to contract.

"From mid-2016 to 3Q17, global trade growth (in volume) gathered significant momentum due to synchronous recovery in import demand from both advanced economies (mainly North America) and EMDEs (Emerging Market and Developing Economies). However, the dynamic moderated somewhat last year in line with the expected deceleration of capital spending in Asian countries.
The momentum weakened sharply in late 2018 amid synchronized global slowdown, trade uncertainty (potential new tariffs on China, Europe and Japan) and rising economic policy uncertainty (U.S. government shutdown, debt ceiling, Brexit, European parliament elections, etc).
In this context, several proxies now suggest that, at some point in 1Q 2019, global trade growth could contract on a YoY basis and will remain a drag on global growth over 2019."
Joe LaVorgna: The Fed has tightened a lot more than you think.

"Economists at the Atlanta Fed created a shadow fed funds rate to measure the full effects of quantitative easing and forward guidance on the funds rate during and after the financial crisis. This rate provides a more accurate reading of the 'true' level of the fed funds rate given the zero bound.
For example, at one stage of the economic recovery, the shadow rate was in sharply negative territory, while the official fed funds rate was slightly above zero. Since then, the shadow rate has meaningfully increased, and the cumulative amount of monetary tightening has been substantial."
Komal Sri-Kumar: Why the Fed has done a 180-degree turn.

"What is behind the 180 degree turn we saw from Fed Chair Jerome Powell on Wednesday [January 30, when the FOMC met]? Inflation numbers have been consistently below the Fed target of 2% but the central bank (under Bernanke, Yellen and Powell) kept insisting that there was an inflation threat. The Federal Funds rate has been increased nine times since December 2015 — four of which were implemented just last year — even as inflation remained relatively tame."
Katie Stockton: Get ready for more stock-market volatility.

"The loss of long-term momentum behind the S&P 500 Index in Q4 was significant. The monthly MACD (moving average convergence-divergence) indicator flashed a 'sell' signal (denoted by red bars) after having spent about two years on a "buy" signal (denoted by green bars).
MACD "sell" signals tend to be associated with bear markets or range-bound markets characterized by a good deal of volatility. We think the latter is the case this time, as in 2015-2016, and would adhere to short-term gauges to facilitate market timing."
John Butters: Almost no earnings growth was expected in Q1.

"Analysts have reduced earnings expectations for companies in the S&P 500 for the first three quarters of 2019, with almost no earnings growth expected for Q1 2019. Downward revisions to earnings estimates for companies in the energy and information technology sectors have been the largest contributors to the reduction in earnings estimates for the index over the past four months."
Ryan Detrick: Midterm-year sell-offs are typically followed by big comebacks.

"The reality is midterm years have seen the largest pullbacks during the four-year Presidential cycle, but if you are willing to hold those scary lows you are typically rewarded. In fact, since 1950, the S&P 500 has never been lower a year off the lows and up 32.0% on average."
Marty Fridson: China’s demographics spell trouble for its growth.

"The Chinese population's projected shift in age distribution toward the elderly will adverse affect one key determinant of GDP growth, namely, growth in the workforce. Productivity increases, the other key GDP driver, will be restrained by past, unproductive investments. The bottom line is that in the future China will not be as formidable an engine of global economic growth that it has been in recent decades."
Alicia Levine: Here's the "doom loop" chart for European banks.

"European banks own their own sovereign debt, held at par and it becomes part of the capital cushion. This is a fatal flaw in the European banking system — one that is silent until it is not. If sovereign credit comes under question and borrowing costs rise, then bank capital is also at risk, creating a 'doom loop' between sovereigns and their banks. Italy and Portugal show the greatest increase of sovereign debt held at the national banks."
With Bryan Besecker, Investment Strategist and Lale Akoner, Global Markets Strategist.
Kristina Hooper: Draghi's exit has 'dramatic consequences' for the Euro Area.

"All eyes have been on the Fed in recent months — very little attention is being paid to the ECB, which will be losing its president, Mario Draghi, in October 2019. This has dramatic consequences for the Euro Area, given that Draghi has been a stabilizing force for markets and the economy.
The attached chart illustrates the calming power he has had by charting systemic stress for the Euro Area (this is a composite indicator tracked by the ECB).
Now he is leaving, and we don’t know who will replace him. It could be a more hawkish ECB president, which could have serious implications for the Euro Area, especially now that it is experiencing a significant economic deceleration … I expect systemic stress will begin rising as we near Draghi’s end date, especially if it's expected that his successor will be more hawkish."
Dave Lutz: US traders aren't watching the bund closely enough.

"I’m very focused on German bunds. With the poor economic data, trade and Brexit uncertainty – and ECB buying, bund yields are taking out 2018 lows, creating a weight on Treasuries.
Don’t think enough US traders watching this relationship — if bunds approach zero, could cause some serious weight in US yields (last time bunds at 0%, the US10YY=1.4%). Great for gold and yield proxies like utilities and REITs – but will crush the US banks."
Helima Croft: Venezuela's crisis is unique among OPEC members.

"The situation in Venezuela continues to devolve amid protests, new cracks in the security services, the Trump Administration recognizing Juan Guaidó as Interim President of Venezuela, and US energy sanctions. It not only has the highest fiscal breakeven among OPEC members in our analysis, but Venezuela is set to further lose hundreds of thousands of barrels per day of production after already seeing its oil production and reserves plummet, leaving the regime increasingly strapped for cash."
Raoul Pal: There's a dangerous head-and-shoulders formation on the 2-year yield.

"The US Government 2-year yield is carving out a topping formation known as a 'head & shoulders'. If this breaks through support, then the decline in yields could become quite dramatic, leading to a re-steepening of the yield curve (the yield curve being the difference between the 10-year yield and the 2-year yield). A re-steepening of this yield curve from extremely low levels is a condition that usually precedes a recession."
For more insights from Raoul Pal, CEO of Real Vision, go to https://www.realvisionresearch.com/macro-insiders.
Cullen Roche: Fears of an imminent recession are overblown.

"[The Orcam US Recession Index] measures the current probability of a recession in the US.
Since most of the substantial bear markets coincide or precede US recessions this is an important indicator of the likelihood of a sustained bear market in the USA. Current levels are consistent with just a 25% probability of recession.
The index is an 'on/off' index so readings less than 100% tend to be highly unreliable. This is a positive sign for the domestic economy and markets."
Neil Dutta: A housing-market bottom is in place.

"The primary reasons for the weakness in housing in 2018 was the rise in mortgage interest rates, stickiness in home prices, and introduction of changes to the deductibility of mortgage interest. We see reasons that a bottom is in place.
First, mortgage interest rates have dropped about 40 basis points over the last nine weeks [as of Jan. 28]. With inflation low, we don’t see much reason for rates to back up meaningfully anytime soon.
Second, home price growth has slowed somewhat even as income growth has picked up. The data are also turning. Mortgage purchase applications are up 13.3% over the last year for the week ending January 18. This has a reasonable relationship with new home sales. Homebuilder sentiment is up modestly, but led by the West and Northeast, the two regions most affected by the mortgage interest deduction."
Glenn Kelman: Low mortgage rates will haunt the housing market for decades.

"Mortgage interest rates dipped as low as 3.3%, a bonanza that seemed relatively short-lived at the time but that will in fact haunt the housing market for the next 30 years: homeowners have become loathe to give up the loan they got in 2012, and can easily find renters to pay the mortgage on their old place, sometimes by renting out the whole house if they want to move, otherwise just a garage that has been converted into a bedroom.
Founded in 2008, AirBnB became the marketplace for this arbitrage between low mortgages and high rents. Between 2006 and 2018, the fraction of Americans renting their home increased by 13%."
Daniel Zhao: Will US wage growth stall in 2019?

"US wage growth finally picked up in late 2018, but remains stubbornly low amid today's historically tight labor market. Glassdoor data suggests wage growth in early 2019 may be flattening. We'll be watching closely to see if employers start to more aggressively boost wages in the months ahead to better attract scarce talent."
Issi Romem: Even married couples need roommates to cut housing costs.

"For first-time married home buyers, especially those looking to buy in those acutely unaffordable West Coast markets, finding a roommate to help defray housing costs may simply be the sensible thing to do.
In 2018, 3.28% of all US households, or nearly 4.2 million households, lived with a roommate or boarder. But among married couples, that rate was just 0.46% (just over 280,000 married households), a scant share to be sure but nevertheless more than double the rate observed in 1995 (the earliest year for which data is available).
Among all married householders, 0.46% live with roommates, up from an historical average of 0.36%. This increase is mostly driven by married homeowners, 0.34% of whom live with roommates, or nearly 40% higher than the historical average."
Jonathan Miller: Manhattan's housing market is changing.

"Manhattan apartment inventory rose sharply below the $3M threshold on a year-over-year basis. Roughly 90% of all Manhattan sales occurred below this level in recent years. Until 2018, the market above this threshold accounted for most of the inventory growth. In recent months, overpriced listings at the high end are being removed from the market."
Gabe Lipton: How much should the rich pay in taxes?

"Freshman US Congresswoman Alexandria Ocasio-Cortez made waves in recent days with her suggestion that the US raise its top marginal tax rate to 70% for income over $10 million dollars. To clarify, this does not mean taking 70% of everyone's income. It means the government would take 70% of any income above $10 million dollars.
Currently the top tax rate in the US is 37%, but just a few decades ago it was nearly twice that level. Here's how top tax rates have evolved since 1970 in some of the world's largest economies."
Kit Juckes: How a weaker yuan caps the euro.
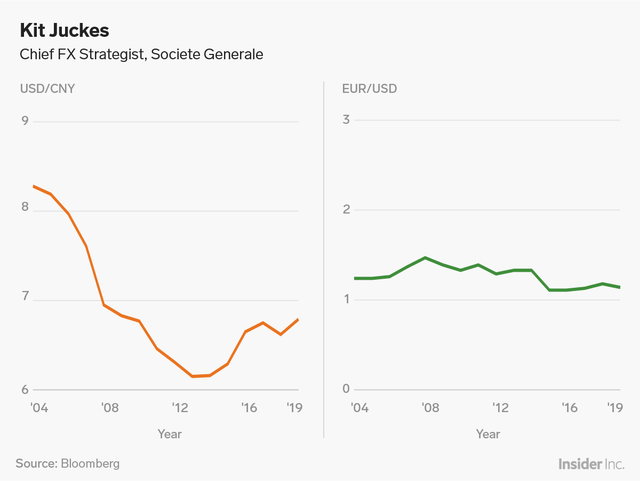
"Markets like to tell a narrative about how currencies move based on their underlying fundamentals, but it’s not that simple. Furthermore, we often used the dollar exchange rate to measure the value of currencies. The Chinese yuan isn’t the world’s most traded currency, but it has by some distance, the biggest weight in the trade weighted basket for the US dollar and the Euro. That makes it important.
At the same time, Chinese currency policy remains shrouded in mystery. That only adds to the Chinese yuan’s importance.
A Chinese policy of currency depreciation, to offset the terms of trade effect of tariffs, would be good for the US dollar bad for the euro and, at the same time, bad for global risk sentiment. By contrast, a policy of allowing some modest yuan strength at the start of this year stabilized the euro and stabilized global risk sentiment even before the FOMC’s volte-face."

 Next Story
 Tesla tells some laid-off employees their separation agreements are canceled and new ones are on the way
 Taylor Swift's 'The Tortured Poets Department' is the messiest, horniest, and funniest album she's ever made
 One of the world's only 5-star airlines seems to be considering asking business-class passengers to bring their own cutlery
 The Future of Gaming Technology
 Stock markets stage strong rebound after 4 days of slump; Sensex rallies 599 pts
 Sustainable Transportation Alternatives
 10 Foods you should avoid eating when in stress
 8 Lesser-known places to visit near Nainital
