Don't fear the VIX. Volatility is here to stay for now, and that's no bad thing.
Advertisement
Amanda Cooper
Sep 23, 2020, 22:34 IST
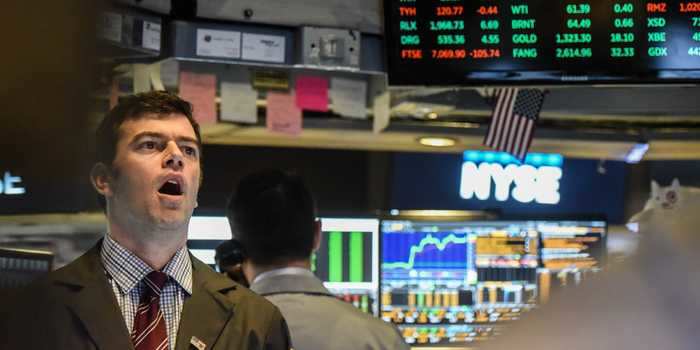
Stephanie Keith/Getty
The Cboe Volatility Index — or VIX, which is commonly referred to as the stock market's fear gauge — is trading at fairly elevated levels and suggests more volatility for months to come, regardless of the outcome of the November election.
The index can take months, or even years, to return to more average levels following a crisis, according to DataTrek data going back 30 years.
Goldman Sachs says volatility is on average 25% higher in October, but there is no evidence that this trend is exacerbated in election years.
Advertisement
Higher volatility looks like it will last well into next year, regardless of the outcome of the November presidential election — or even the arrival of an effective vaccine against COVID-19. That's according to 30 years of data suggesting that volatility takes months, or even years, to subside after a crisis.
Few bellwethers of investor sentiment capture the headlines quite as often as the Cboe Volatility Index, or VIX, which essentially tracks future expectations of volatility in the benchmark S&P 500.
This year, with the turmoil unleashed on the global financial system by the coronavirus pandemic, the index predictably shot to levels last seen in late 2008, in the darkest days of the financial crisis.
The VIX — also known as the stock market's "fear index" — has since subsided from March's multi-year highs, in line with the bounce back in US stocks.
In spite of a degree of optimism over the outlook for corporate profits and an improving economic backdrop, the VIX is holding around 26.6, well above where it was at this point last year, at 14.91. It's also well above the 15.8 average seen over the last five years, although it is down from mid-March's peak above 85.0.
Analysts at DataTrek draw a comparison with the behavior of the VIX towards the end of the 2008-2009 financial crisis, when the index traded at an average level of 24.9. The average for the final quarter of that year was 23.1, compared with an average of 28.84 so far in September this year, based on exchange data.
"The VIX remains elevated long after the depths of a crisis, as we can see with September 2009's mean reading of 24.9 or Q4 2009's 23.1," DataTrek co-founder Nicolas Colas said in a note this week. "Don't, in other words, expect to see 2020's VIX drop below the long run mean of 19.4 any time soon."
A reading below 20.0 in the VIX suggests investors perceive market risk to be low, while a reading above 30.0 indicates more acute nervousness.
Volatility tends to trade in cycles, just like any other asset class. It has periods when it "runs hot" — such as those during 1997-2003 and 2007-2012, as well as periods when it "seems to go to sleep", Colas said.
Advertisement
"We need to remember that the long run history of the VIX is really a tale of 2 sorts of markets – wild or mild – and these tend to cluster," he said. "We're likely starting a new phase of high-vol market activity, but returns can still be good."
Historical chart of the VIX volatility indexDataTrek/St Louis Fed
Fundstrat Global Advisors managing partner Tom Lee recently told CNBC that while the stock market was "looking dangerous" in terms of the uncertainty building over the election, September's sell-off was a good opportunity to buy, not least because "the VIX is not actually making a new high," he said.
Aside from its "hot-cold" cycles, at the moment, VIX derivatives are suggesting heightened anxiety, not just around the November 3 election, which many believe may not yield conclusive results immediately, but also around the weeks following the vote.
However, according to Goldman Sachs, this is by no means unusual. Based on research over the last 30 years, Goldman says firstly that volatility tends to be 25% higher in October than in other months. The firm adds that, aside from that, there is no evidence that election years have higher volatility than other years.
Advertisement
"Volatility does shift from October to November. We believe investors and corporates are reluctant to take strong directional views on stocks ahead of a major election," Goldman said in a note on September 18. "This likely pushes October volatility into November as investors delay implementing their views until after knowing the results of the election."
October's track record as a high-volatility month has been even more marked by sharp price swings dating back to 1997, during the Asian financial crisis. Goldman noted that it also occurred in 2002, as the markets were recovering from the bursting of the dot-com bubble, and in 2008, when US investment bank Lehman Brothers collapsed as part of the subprime lending crisis.
DataTrek's Colas said political uncertainty is a far smaller factor for current volatility in the US stock market.
"The (6%) difference between today's VIX … and September 2009's average of 24.9 is a reasonable way of thinking about how much 2020's political uncertainty is affecting US equity volatility. It is measurable, but not as large as one might think," he said.
NewsletterSIMPLY PUT - where we join the dots to inform and inspire you. Sign up for a weekly brief collating many news items into one untangled thought delivered straight to your mailbox.


 Next Story
 I spent $2,000 for 7 nights in a 179-square-foot room on one of the world's largest cruise ships. Take a look inside my cabin.
 Colon cancer rates are rising in young people. If you have two symptoms you should get a colonoscopy, a GI oncologist says.
 Saudi Arabia wants China to help fund its struggling $500 billion Neom megaproject. Investors may not be too excited.
 Catan adds climate change to the latest edition of the world-famous board game
 Tired of blatant misinformation in the media? This video game can help you and your family fight fake news!
 Tired of blatant misinformation in the media? This video game can help you and your family fight fake news!
 JNK India IPO allotment – How to check allotment, GMP, listing date and more
 Indian Army unveils selfie point at Hombotingla Pass ahead of 25th anniversary of Kargil Vijay Diwas
