
The 20 cities in the Midwest that Americans are escaping in droves
Advertisement


20. Muncie, Indiana, had a net population loss from migration of 2,889 between 2010 and 2018 — 2.5% of the metro's 2010 population of 117,671.


19. Springfield, Illinois, had a net population loss from migration of 5,327 between 2010 and 2018 — 2.5% of the metro's 2010 population of 210,170.

Advertisement
18. Bay City, Michigan, had a net population loss from migration of 2,745 between 2010 and 2018 — 2.5% of the metro's 2010 population of 107,771.

17. Topeka, Kansas, had a net population loss from migration of 5,964 between 2010 and 2018 — 2.6% of the metro's 2010 population of 233,870.

Advertisement
16. Manhattan, Kansas, had a net population loss from migration of 2,405 between 2010 and 2018 — 2.6% of the metro's 2010 population of 92,719.

15. Mansfield, Ohio, had a net population loss from migration of 3,332 between 2010 and 2018 — 2.7% of the metro's 2010 population of 124,475.

Advertisement
14. Youngstown-Warren-Boardman, Ohio-Pennsylvania, had a net population loss from migration of 15,617 between 2010 and 2018 — 2.8% of the metro's 2010 population of 565,773.

13. Bloomington, Illinois, had a net population loss from migration of 5,169 between 2010 and 2018 — 2.8% of the metro's 2010 population of 186,133.

Advertisement
12. Carbondale-Marion, Illinois, had a net population loss from migration of 4,116 between 2010 and 2018 — 3.3% of the metro's 2010 population of 126,575.

11. Toledo, Ohio, had a net population loss from migration of 20,390 between 2010 and 2018 — 3.3% of the metro's 2010 population of 610,001.

Advertisement
10. Chicago-Naperville-Elgin, Illinois-Indiana-Wisconsin, had a net population loss from migration of 365,909 between 2010 and 2018 — 3.9% of the metro's 2010 population of 9,461,105.

9. Sioux City, Iowa, had a net population loss from migration of 6,978 between 2010 and 2018 — 4.1% of the metro's 2010 population of 168,563.

Advertisement
8. Kankakee, Illinois, had a net population loss from migration of 5,386 between 2010 and 2018 — 4.7% of the metro's 2010 population of 113,449.

7. Lima, Ohio, had a net population loss from migration of 5,125 between 2010 and 2018 — 4.8% of the metro's 2010 population of 106,331.

Advertisement
6. Peoria, Illinois, had a net population loss from migration of 18,737 between 2010 and 2018 — 4.9% of the metro's 2010 population of 379,186.

5. Saginaw, Michigan, had a net population loss from migration of 10,863 between 2010 and 2018 — 5.4% of the metro's 2010 population of 200,169.

Advertisement
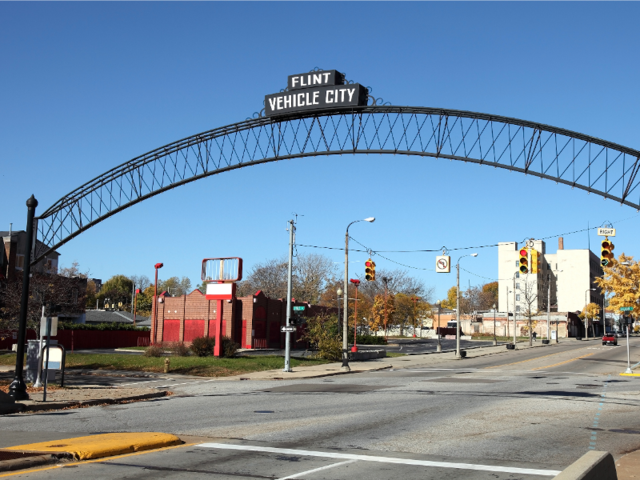
4. Flint, Michigan, had a net population loss from migration of 23,255 between 2010 and 2018 — 5.5% of the metro's 2010 population of 425,790.
3. Rockford, Illinois, had a net population loss from migration of 20,375 between 2010 and 2018 — 5.8% of the metro's 2010 population of 349,431.

Advertisement
2. Decatur, Illinois, had a net population loss from migration of 7,220 between 2010 and 2018 — 6.5% of the metro's 2010 population of 110,768.

1. Danville, Illinois, had a net population loss from migration of 5,455 between 2010 and 2018 — 6.7% of the metro's 2010 population of 81,625.

Advertisement
 Next Story
Advertisement
 Tesla tells some laid-off employees their separation agreements are canceled and new ones are on the way
 Taylor Swift's 'The Tortured Poets Department' is the messiest, horniest, and funniest album she's ever made
 One of the world's only 5-star airlines seems to be considering asking business-class passengers to bring their own cutlery
 Stock markets stage strong rebound after 4 days of slump; Sensex rallies 599 pts
 Sustainable Transportation Alternatives
 10 Foods you should avoid eating when in stress
 8 Lesser-known places to visit near Nainital
 World Liver Day 2024: 10 Foods that are necessary for a healthy liver
