
Trump boasts the economy is the best it's ever been. Here are 9 charts showing how it's fared compared to the Obama and Bush presidencies.
Overall economic growth, as measured by quarterly GDP growth rates, has been steady.
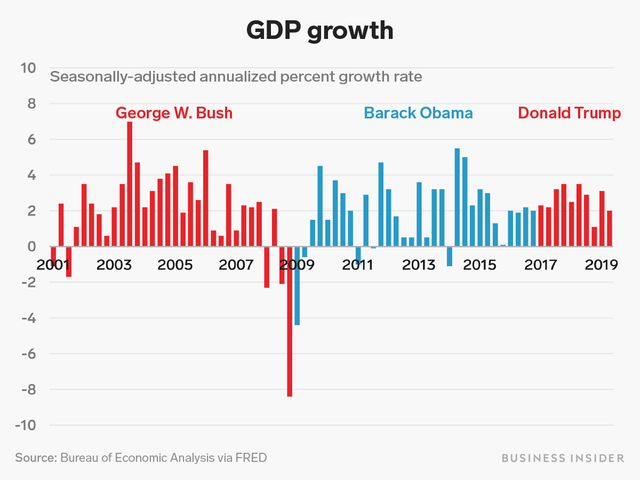

Gross domestic product measures the total value of all goods and services provided by the country in a year, essentially the economic output. The ideal GDP growth rate is between 2% and 3%.
GDP growth was consistently strong during the George W. Bush administration, averaging out to 2.1 percent per year when adjusted for inflation, according to the Hudson Institute. But during the financial crisis, the US GDP plummeted and the economy contracted 2.5 percent in 2009.
The Obama administration then confronted the worst economic crisis since the Great Depression when it initially took office. It passed a massive stimulus package in February 2009 aimed at jumpstarting the economy — and it was successful. The Congressional Budget Office said in a report that GDP growth was higher from 2009-2012 in part due to the package.
Trump has benefited from Obama's economic stewardship, as GDP growth under his watch has consistently been between two to three percent. In 2018, it was 2.9 percent. Economic forecasters, however, expect the nation's steady GDP growth to slow down in 2019, dragged down by trade tensions and weaker growth overseas.
Unemployment shot up dramatically during the financial crisis at the end of George W. Bush's and the start of Barack Obama's terms before steadily dropping for most of the decade.
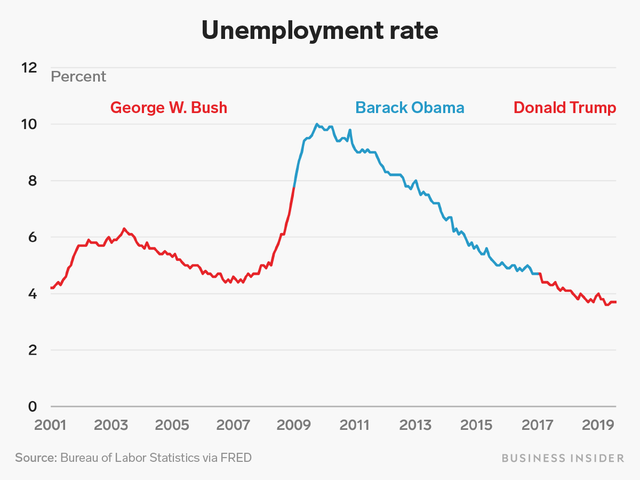
The unemployment rate measures the share of the labor force that is jobless and it fluctuates depending on economic conditions. But when the economy is healthy and growing, it can be expected to decline.
The Federal Reserve estimates the natural rate of unemployment to range from 4.5% to 5%, which fiscal and monetary policymakers use to project full employment.
The unemployment rate hovered between 4% and 6% for most of the Bush presidency, spiking dramatically during the 2008-09 financial crisis to 7.8% just as he left office in January 2009.
As a result, Obama inherited an economy in free-fall. The unemployment rate peaked at 10.2 percent in October 2009 during the recession and 8.7 million jobs were lost from early 2007 and 2010, according to the Center for Budget and Policy Priorities. But it started falling steadily in 2011 and that trend continued for the rest of the Obama presidency.
President Trump took office as the economy continued its recovery — and as it underwent a decade-long expansion, the longest in American history. The current employment rate stood at 3.7% as of August 2019, the lowest point in a half-century.
Job growth, another key labor market measure, followed a similar pattern. The Great Recession destroyed millions of jobs per quarter, but the economy has steadily added around 200,000 jobs per month since President Obama's second term.
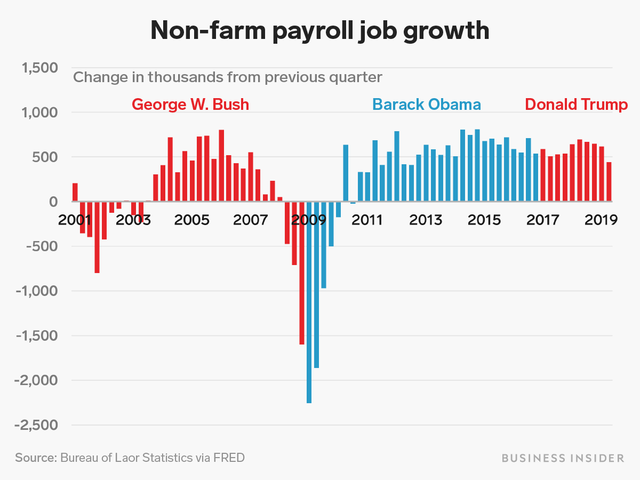
Job growth is another key indicator of the economy's health.
During the first few years of the Bush administration, the economy struggled adding jobs. A recession struck in 2001, which lasted eight months and shed jobs at that time. Then it bounced back — and the growth was steady until the 2008 financial crisis when jobs disappeared at a breakneck pace. In January 2009, 808,000 jobs were lost, the low point for this indicator during the Great Recession.
Obama tried stemming those job losses early on in his term, and the economy started stabilizing in 2010. They soon turned into gains — and he averaged out around 109,000 jobs created every month for eight years (when those massive losses at the outset of his presidency are also taken into account.)
Job growth during the Trump presidency has largely matched Obama's, fueled by a strong economy, But the trade wars he's embarked on has started to hurt job creation and businesses pull back on hiring amidst the uncertainty.
Wage growth for non-supervisory and production workers in the private sector slowed down after the recession, but has picked up during President Trump's first term as the labor market has tightened.
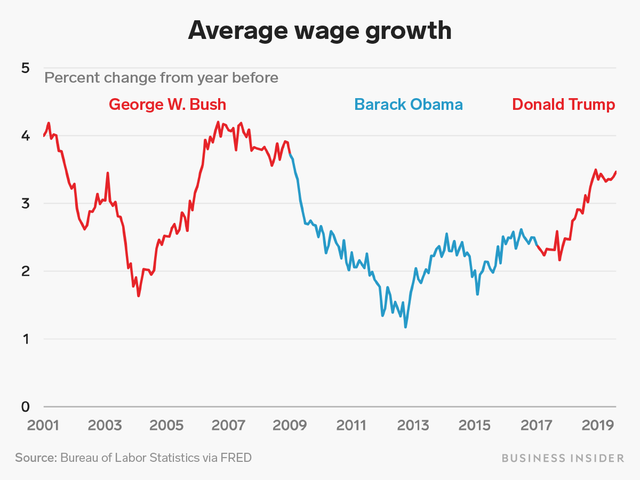
Wages rise when unemployment is low and hiring is strong — and that employers are willing to pay more to attract workers.
Wage gains were steady for much of the Bush administration, fluctuating between two and four percent each year.
Then wage growth took a hit during the financial crisis, and gains were anemic for much of the Obama presidency. The Obama economic team referred to it as "the unfinished business" of his time in the Oval Office.
During the Trump presidency, wages have climbed and its now growing at more than 3 percent for the first time in a decade. The GOP tax cuts may have helped accelerate the trend, but economists also point to the tight labor market as a factor.
The typical household's income fell dramatically after the recession, but has recovered since Obama's second term.
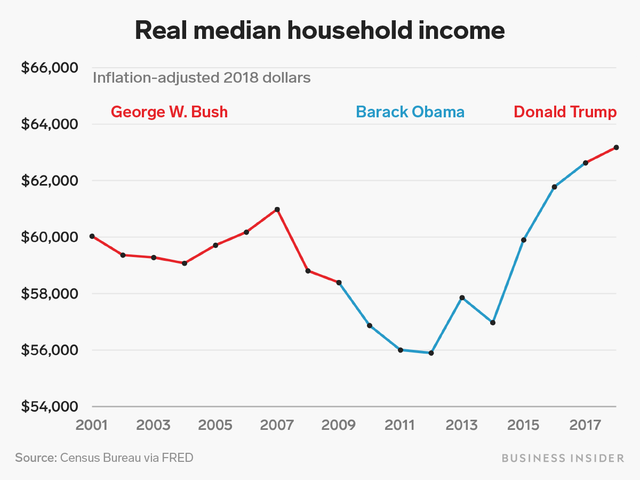
Median household income measures the average income of middle class families.
Bush's first term saw household's incomes trend downward, but they swung upward until 2007 before declining steeply during the Great Recession.
With the economy in a recession during the first part of the Obama presidency, families experienced a substantial decline in their incomes. However, incomes started recovering in 2012.
That trend has continued during Trump's presidency. By 2018, the average middle-class family saw their income rise to $63,179, according to the Census Bureau.
The stock market hit its bottom early in Obama's first term, and has been mostly increasing ever since, although Trump's first term has seen a lot of volatility amid uncertainty around Trump's trade disputes with other countries and concern that the economy may be slowing.
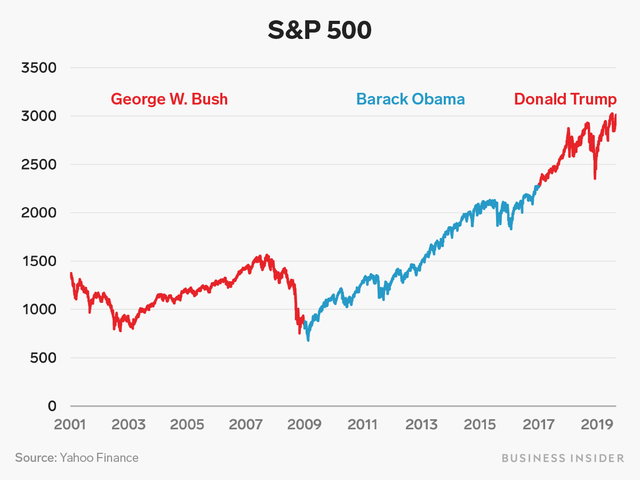
The S&P 500 measures the stock performance of the 500 largest corporations listed on US exchanges.
The S&P ticked upward for much of the Bush presidency, but took a severe hit during the Great Recession along with the rest of the stock market.
Obama presided over the S&P's steady recovery, which continued through the end of his presidency.
Under Trump, that recovery has swung between gains and losses, brought on by the recent recession scare coupled with the uncertainty stemming from his trade war with China.
The federal deficit ballooned in the 2009 fiscal year, as the government ramped up spending and tax revenues fell in the wake of the crisis. Deficits shrank in subsequent years, but have increased under Trump.
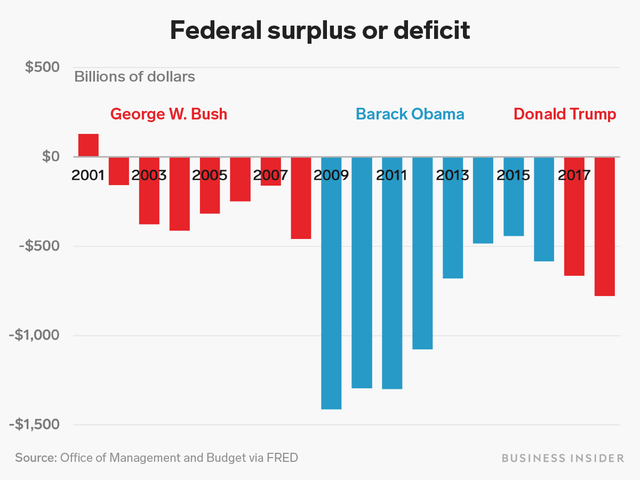
The federal deficit is the shortfall between federal revenue and how much the government spends in a fiscal year. When the economy is healthy, the federal deficit is expected to shrink since the government pulls back on spending and has more space to raise taxes.
Bush took over a strong economy from his predecessor, Bill Clinton, with a budget surplus of $128 billion in fiscal year 2001. And it was the last time the US government had a surplus on its hands. The wars in Iraq and Afghanistan, as well as a series of tax cuts, erased it and jacked up the deficit.
Obama ran massive deficits in his 2009 stimulus package to jolt the economy during the Great Recession. Then the next year, he passed an $858 billion tax cut that included an extension of the Bush tax cuts that had similarly ramped up deficits almost a decade before.
Trump has continued running massive deficits during his presidency, which only widened with the passage of the 2017 GOP tax cuts.
As a result of those deficits, the total federal debt has increased over the last three presidents and is now over $22 trillion.
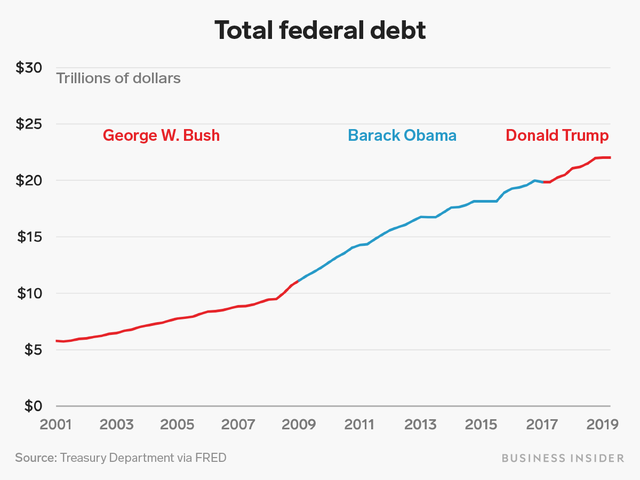
The federal debt is the amount of money the federal government owes. And its been on the upswing since the start of the 21st century.
The debt increased steadily under Bush, the result of a costly war on terror and the invasions of Afghanistan and Iraq. According to the Costs of War Project at Brown University, the price tag of the post-9/11 wars totaled $5.9 trillion through fiscal year 2019. The tax cuts he passed also played a role in piling more onto the debt — and it was nearly $10 trillion by the time he left office, double what it was at the start of his presidency.
Obama's stimulus packages also added a substantial amount of money to the debt, though it helped put the nation back on track economically. According to Department of Treasury data and Congressional Budget Office projections, the national debt grew 84% under Obama's watch by the end of fiscal year of 2016 — slightly more than it had under Bush at 75%.
Trump vowed to erase the debt during his presidency, but he's done no such thing and instead has only added to it.
Trade is one of Trump's signature issues. Despite his aggressive trade moves, the total monthly trade deficit in goods and services — that is, the value of goods and services exported by the US minus the value of imports — has gotten larger in the last couple years.
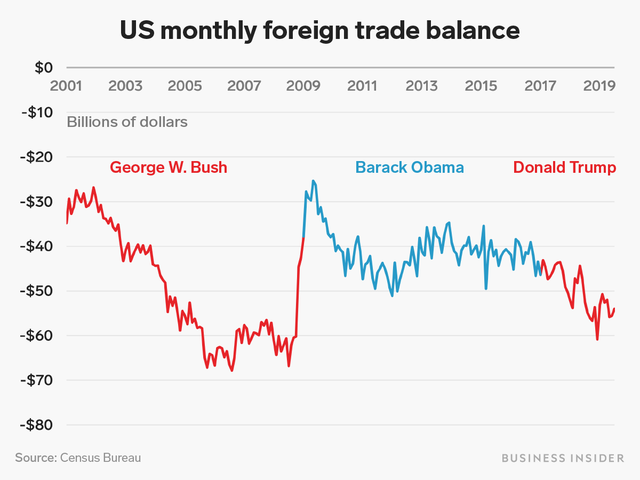
The trade balance calculates a country's exports minus its imports in a given period. When a nation imports more goods than it exports, the result would be a trade deficit.
The Bush administration's trade imbalance increased for much of his two terms in office, partially brought on by additional trading with China as it was integrated into global markets. Then trade decreased sharply during the Great Recession.
The trade balance fluctuated but held steady during the Obama administration. And during Trump era, the deficit started to increase to levels not seen since the Bush administration — despite him vowing to "start whittling it down, and as fast as possible" in 2017. Last year, the trade deficit stood at $891 billion, according to the Bureau of Economic Analysis.
Still, a growing deficit partially means the economy is growing, the result of increased consumer spending that leads to more imports.
 Next Story
 I tutor the children of some of Dubai's richest people. One of them paid me $3,000 to do his homework.
 A 13-year-old girl helped unearth an ancient Roman town. She's finally getting credit for it over 90 years later.
 It's been a year since I graduated from college, and I still live at home. My therapist says I have post-graduation depression.
 Sell-off in Indian stocks continues for the third session
 Samsung Galaxy M55 Review — The quintessential Samsung experience
 The ageing of nasal tissues may explain why older people are more affected by COVID-19: research
 Amitabh Bachchan set to return with season 16 of 'Kaun Banega Crorepati', deets inside
 Top 10 places to visit in Manali in 2024
