
The 20 US cities where everyone's moving to - and they're nearly all in Florida
Advertisement


20. Coeur d'Alene, Idaho, had net migration of 19,111 between 2010 and 2018 — 13.8% of the metro's 2010 population of 138,494.


19. Crestview-Fort Walton Beach-Destin, Florida, had net migration of 32,718 between 2010 and 2018 — 13.9% of the metro's 2010 population of 235,865.

Advertisement
18. Raleigh, North Carolina, had net migration of 159,756 between 2010 and 2018 — 14.1% of the metro's 2010 population of 1,130,490.

17. Deltona-Daytona Beach-Ormond Beach, Florida, had net migration of 87,461 between 2010 and 2018 — 14.8% of the metro's 2010 population of 590,289.

Advertisement
16. Port St. Lucie, Florida, had net migration of 62,896 between 2010 and 2018 — 14.8% of the metro's 2010 population of 424,107.

15. Midland, Texas, had net migration of 22,239 between 2010 and 2018 — 15.7% of the metro's 2010 population of 141,671.

Advertisement
14. Lakeland-Winter Haven, Florida, had net migration of 96,548 between 2010 and 2018 — 16.0% of the metro's 2010 population of 602,095.

13. Orlando-Kissimmee-Sanford, Florida, had net migration of 344,022 between 2010 and 2018 — 16.1% of the metro's 2010 population of 2,134,411.

Advertisement
12. Greeley, Colorado, had net migration of 41,180 between 2010 and 2018 — 16.3% of the metro's 2010 population of 252,825.

11. Naples-Immokalee-Marco Island, Florida, had net migration of 56,188 between 2010 and 2018 —17.5% of the metro's 2010 population of 321,520.

Advertisement
10. Sebastian-Vero Beach, Florida, had net migration of 24,647 between 2010 and 2018 — 17.9% of the metro's 2010 population of 138,028.

9. St. George, Utah, had net migration of 24,835 between 2010 and 2018 — 18.0% of the metro's 2010 population of 138,115.

Advertisement
8. Austin-Round Rock, Texas, had net migration of 310,931 between 2010 and 2018 — 18.1% of the metro's 2010 population of 1,716,289.

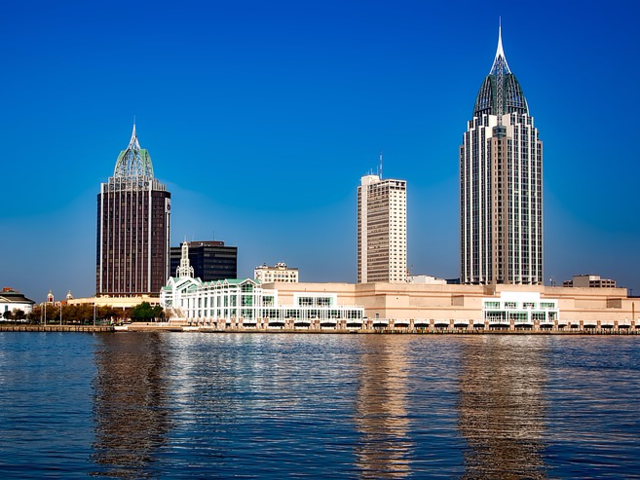
7. Daphne-Fairhope-Foley, Alabama, had net migration of 33,655 between 2010 and 2018 — 18.5% of the metro's 2010 population of 182,265.
Advertisement
6. Bend-Redmond, Oregon, had net migration of 30,773 between 2010 and 2018 — 19.5% of the metro's 2010 population of 157,733.

5. North Port-Sarasota-Bradenton, Florida, had net migration of 140,889 between 2010 and 2018 — 20.1% of the metro's 2010 population of 702,281.

Advertisement
4. Cape Coral-Fort Myers, Florida, had net migration of 135,696 between 2010 and 2018 — 21.9% of the metro's 2010 population of 618,754.

3. Punta Gorda, Florida, had net migration of 36,551 between 2010 and 2018 — 22.8% of the metro's 2010 population of 159,978.

Advertisement
2. Myrtle Beach-Conway-North Myrtle Beach, South Carolina-North Carolina, had net migration of 105,460 between 2010 and 2018 — 28.0% of the metro's 2010 population of 376,722.

1. The Villages, Florida, had net migration of 43,639 between 2010 and 2018 — 46.7% of the metro's 2010 population of 93,420.

Advertisement
 Next Story
Advertisement
 I spent 2 weeks in India. A highlight was visiting a small mountain town so beautiful it didn't seem real.
  I quit McKinsey after 1.5 years. I was making over $200k but my mental health was shattered.
 Some Tesla factory workers realized they were laid off when security scanned their badges and sent them back on shuttles, sources say
 Top places to visit in Auli in 2024
 Sustainable Transportation Alternatives
 Why are so many elite coaches moving to Western countries?
 Global GDP to face a 19% decline by 2050 due to climate change, study projects
 5 things to keep in mind before taking a personal loan
