
The economy of every state, ranked from worst to best


51. Mississippi


Mississippi's Q1 2018 per capita GDP of $38,313, August 2018 average weekly earnings of $697, and 2.2% decline in wages between August 2017 and August 2018 were all the lowest among the 50 states and DC.
50. Alaska

Alaska's August 2018 unemployment rate of 6.7% was the highest in the country, and its 0.9% decline in the number of non-farm payroll jobs between August 2017 and August 2018 was the worst among the 50 states and DC.
49. Arkansas

Arkansas Q1 2018 per capita GDP of $42,282 and GDP growth rate of 0.0% were both the second-lowest among the 50 states and DC, as was the state's August 2018 average weekly earnings of $734.
47. Kentucky

Kentucky's non-farm payroll jobs growth rate of 0.4% between August 2017 and August 2018 was the third-lowest in the country, and the state's wage growth rate of 0.1% over that same period was the fourth-lowest.
47. West Virginia

West Virginia's August 2018 unemployment rate of 5.3% was the third-highest among the 50 states and DC, and the state's Q1 2018 per capita GDP of $43,800 was the fourth-lowest.
46. Alabama

Alabama's Q1 2018 per capita GDP of $44,289 was the fifth-lowest in the country. The state's GDP growth rate of 1.2% in that quarter was lower than the average rate of 1.7% among the 50 states and DC.
45. Maine

Maine's GDP growth rate of 0.6% in Q1 2018 was the fifth-lowest among the 50 states and DC, and its average weekly wage of $810 in August 2018 was the eighth-lowest.
44. New Mexico

New Mexico's average weekly wage of $745 in August 2018 was the third-lowest among the 50 states in DC. The state's 4.6% unemployment rate that month was tied for sixth-highest.
43. Delaware

Delaware's Q1 2018 per capita GDP of $78,796 was the fourth-highest among the states and DC, but its 1.5% decline in average weekly wages between August 2017 and August 2018 was the second-worst in the country.
42. Indiana

Indiana's average weekly wage growth rate of 1.2% between August 2017 and August 2018 was the eighth-lowest among the 50 states and DC, and its non-farm payroll job growth rate of 0.9% over that period was the tenth-lowest.
Indiana fell several places since our last state economy ranking, when it placed 15th among the states and DC.
41. Louisiana

Louisiana's unemployment rate of 5.0% in August 2018 was the fourth-highest in the country, and its non-farm payroll job growth rate of 0.8% between August 2017 and August 2018 was the eighth-lowest.
40. Nebraska

Nebraska's Q1 2018 GDP growth rate of 0.9% was the seventh-lowest among the 50 states and DC. In brighter news, the state's August 2018 unemployment rate of 2.8% was tied for fifth-lowest in the country.
39. Ohio

Ohio's August 2018 unemployment rate of 4.6% was tied for sixth-highest in the country, and its Q1 2018 per capita GDP of $57,273 was slightly below the average of $60,895 among the 50 states and DC.
38. Vermont

Vermont's August 2018 unemployment rate of 2.8% was tied for fifth-lowest among the 50 states and DC. However, the state had a 0.6% decline in non-farm payroll jobs between August 2017 and August 2018, making it one of only two states with a negative jobs growth rate.
37. New Hampshire

Average weekly wages declined 1.2% between August 2017 and August 2018 in New Hampshire, the third-worst rate among the 50 states and DC. On the bright side, the state's 2.7% unemployment rate in August 2018 was the fourth-lowest in the country.
36. Rhode Island

Rhode Island's Q1 2018 GDP growth rate of 1.3% was a bit below the average rate among the 50 states and DC of 1.7%, while its wage growth rate of 3.2% between August 2017 and August 2018 was in line with the national average rate.
35. Georgia

Georgia's wage growth rate of 0.9% between August 2017 and August 2018 was the seventh-lowest in the country, and its August 2018 unemployment rate of 3.8% matched the average unemployment rate among the 50 states and DC.
Georgia fell several places since our last state economy ranking, when it placed 11th.
34. North Dakota
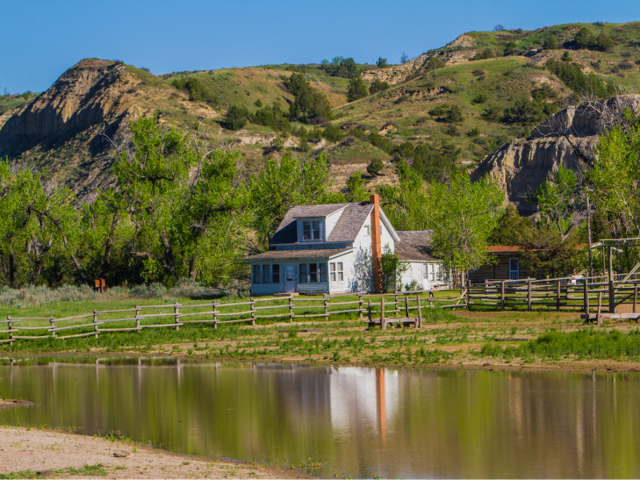
North Dakota's August 2018 unemployment rate of 2.6% was the third-lowest in the country. However, the state had the only negative economic growth rate among the 50 states and DC, with GDP declining by 0.6% in Q1 2018.
North Dakota improved considerably from our last state economy ranking, where it placed 50th in the country.
33. Illinois
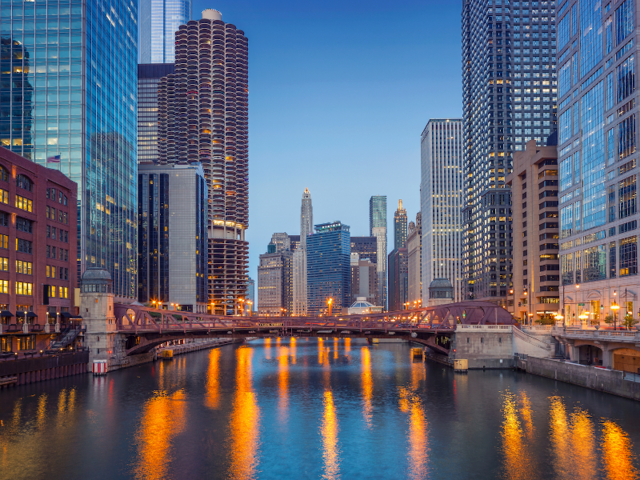
Illinois' non-farm payroll job growth rate of 0.8% between August 2017 and August 2018 was the seventh-lowest in the country. The state's Q1 2018 per capita GDP of $65,889 was a bit higher than the average among the 50 states and DC of $60,895.
32. Idaho

Idaho's non-farm payroll job growth rate of 3.1% between August 2017 and August 2018 was the fifth-highest among the 50 states in DC. However, the state's Q1 2018 per capita GDP of $43,024 and GDP growth rate of 0.4% were both the third-lowest in the country.
31. Kansas
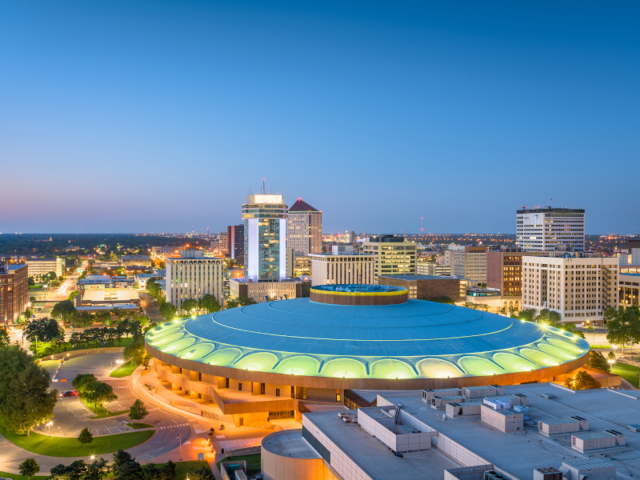
Kansas' Q1 2018 GDP growth rate of 0.5% was the fourth-lowest in the country, but its August 2018 unemployment rate of 3.3% was well below the average rate of 3.8% among the 50 states and DC.
30. Pennsylvania

Pennsylvania's Q1 2018 GDP growth rate of 2.0% was a little higher than the average rate among the 50 states and DC of 1.7%, and its per capita GDP of $60,574 was just below the average of $60,895.
29. Michigan

Michigan's average weekly wage growth rate of 4.8% between August 2017 and August 2018 was the tenth-highest in the country, and its August 2018 unemployment rate of 4.1% was slightly higher than the average rate of 3.8% among the 50 states and DC.
28. New Jersey

New Jersey's average weekly wage of $1,001 in August 2018 was the eighth-highest among the 50 states and DC, while its Q1 2018 GDP per capita of $67,486 was the eleventh-highest.
27. Arizona

Arizona's non-farm payroll job growth rate of 2.9% between August 2017 and August 2018 was the sixth-highest in the country. Despite that, the state's August 2018 unemployment rate of 4.6% was tied for sixth-highest among the 50 states and DC.
26. South Carolina

South Carolina's Q1 2018 per capita GDP of $44,717 was the sixth-lowest in the country. However, the state's August 2018 unemployment rate of 3.4% was a bit below the average rate of 3.8% among the 50 states and DC.
25. Missouri
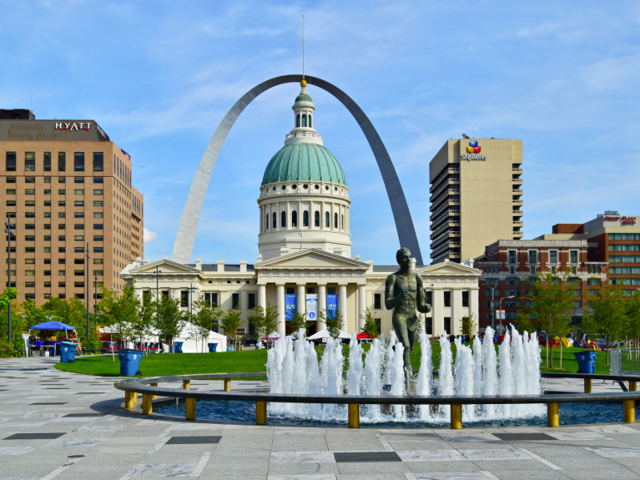
Missouri's Q1 2018 GDP growth rate of 2.4% was above the average rate of 1.7% among the 50 states and DC, but its per capita GDP of $51,181 was below the average of $60,895.
24. Oklahoma

Oklahoma's 3.7% unemployment rate in August 2018 was just below the average rate among the 50 states and DC of 3.8%, and its Q1 2018 per capita GDP of $49,440 was below the average of $60,895.
23. New York

New York's Q1 2018 per capita GDP of $79,503 was the second-highest among the 50 states and DC, but its GDP growth rate of 1.1% was the tenth-lowest.
22. Maryland

Maryland's average weekly wage growth rate of 5.1% between August 2017 and August 2018 was the seventh-highest among the 50 states and DC, but its non-farm payroll job growth rate of 0.7% over that period was the sixth-lowest.
21. Tennessee

Tennessee's August 2018 unemployment rate of 3.6% was a little better than the average rate among the 50 states and DC of 3.8%, while its Q1 2018 per capita GDP of $52,972 was below the average of $60,895.
20. Montana

Montana's average weekly wage growth rate of 5.5% between August 2017 and August 2018 was the third-highest among the 50 states and DC, but its Q1 2018 per capita GDP of $46,870 was the eighth-lowest.
19. Wisconsin

Wisconsin's August 2018 unemployment rate of 3.0% was tied for tenth-lowest among the 50 states and DC, and its average weekly wage growth rate of 5.0% between August 2017 and August 2018 was the eighth-highest.
18. Oregon

Oregon's non-farm payroll job growth rate of 2.4% between August 2017 and August 2018 was the tenth-highest in the country, and its August 2018 unemployment rate of 3.8% was right in line with the average rate among the 50 states and DC.
17. Nevada

Nevada's non-farm payroll job growth rate of 3.3% between August 2017 and August 2018 was the second-highest among the 50 states and DC, but its August 2018 average weekly wage of $811 was the ninth-lowest.
16. Connecticut

Connecticut's Q1 2018 per capita GDP of $74,837 was the fifth-highest among the 50 states and DC, and its August 2018 average weekly wage of $1,075 was the fourth-highest.
15. California

California's August 2018 average weekly wage of $1,060 was the fifth-highest in the country, and its Q1 2018 per capita GDP of $71,506 was the ninth-highest.
14. Minnesota

Minnesota's August 2018 unemployment rate of 2.9% was tied for eighth-lowest among the 50 states and DC, and its average weekly wage in that month of $988 was tenth-highest.
13. North Carolina

North Carolina's average weekly wage growth rate of 5.3% between August 2017 and August 2018 was the fourth-highest in the country. The state's Q1 2018 GDP growth rate of 2.1% was higher than the average rate among the 50 states and DC of 1.7%.
12. South Dakota
South Dakota's Q1 2018 GDP growth rate of 3.1% was the third-highest among the 50 states and DC, but its August 2018 average weekly wage of $763 was the fourth-lowest.
South Dakota moved up several places since our last state economy ranking, when it placed last among the 50 states and DC.
11. Florida

Florida's non-farm payroll job growth rate of 2.6% between August 2017 and August 2018 was the ninth-highest among the 50 states and DC, and its Q1 2018 GDP growth rate of 2.5% was tied for ninth-highest.
10. Iowa

Iowa's Q1 2018 GDP growth rate of 2.9% was tied for fifth-highest among the 50 states and DC, and its August 2018 unemployment rate of 2.5% was second-lowest.
9. Virginia

Virginia's average weekly wage growth rate of 4.8% between August 2017 and August 2018 was the ninth-highest among the 50 states and DC, and its August 2018 unemployment rate of 3.0% was tied for tenth-lowest.
8. Massachusetts

Massachusetts' Q1 2018 per capita GDP of $79,047 and its average weekly wage of $1,100 in August 2018 were both the third-highest among the 50 states and DC.
7. Texas

Texas' non-farm payroll job growth rate of 3.2% between August 2017 and August 2018 was the fourth-highest among the 50 states and DC, and its Q1 2018 GDP growth rate of 2.9% was tied for fifth-highest.
6. Utah

Utah's Q1 2018 GDP growth rate of 3.2% was the second-highest among the 50 states and DC, and its non-farm payroll job growth rate of 3.5% between August 2017 and August 2018 was the highest in the country.
5. Hawaii

Hawaii's August 2018 unemployment rate of 2.1% was the lowest among the 50 states and DC, and its average weekly wage growth rate of 5.2% between August 2017 and August 2018 was the fifth-highest.
4. Wyoming

Wyoming's average weekly wage growth rate of 9.2% between August 2017 and August 2018 was by far the highest among the 50 states and DC. The state's Q1 2018 GDP growth rate of 2.9% was tied for fifth-highest in the country.
3. Colorado

Colorado's Q1 2018 GDP growth rate of 3.0% was the fourth-highest among the 50 states and DC, and its average weekly wage growth rate of 5.5% was the second-highest.
2. Washington

Washington's Q1 2018 GDP growth rate of 3.6% was the highest among the 50 states and DC, and its average weekly wage of $1,124 in August 2018 was the second-highest.
1. District of Columbia

The nation's capital once again comes in first on our economic ranking. DC's Q1 2018 GDP per capita of $195,283 was by far the highest in the country, as was its August 2018 average weekly wage of $1,485.
 Next Story
 I spent $2,000 for 7 nights in a 179-square-foot room on one of the world's largest cruise ships. Take a look inside my cabin.
 Colon cancer rates are rising in young people. If you have two symptoms you should get a colonoscopy, a GI oncologist says.
 Saudi Arabia wants China to help fund its struggling $500 billion Neom megaproject. Investors may not be too excited.
 Catan adds climate change to the latest edition of the world-famous board game
 Tired of blatant misinformation in the media? This video game can help you and your family fight fake news!
 Tired of blatant misinformation in the media? This video game can help you and your family fight fake news!
 JNK India IPO allotment – How to check allotment, GMP, listing date and more
 Indian Army unveils selfie point at Hombotingla Pass ahead of 25th anniversary of Kargil Vijay Diwas
