
These 6 maps show how the American economy is doing right now
Advertisement


Hawaii had the lowest August 2018 unemployment rate of 2.1%, while Alaska's 6.7% rate was the highest.


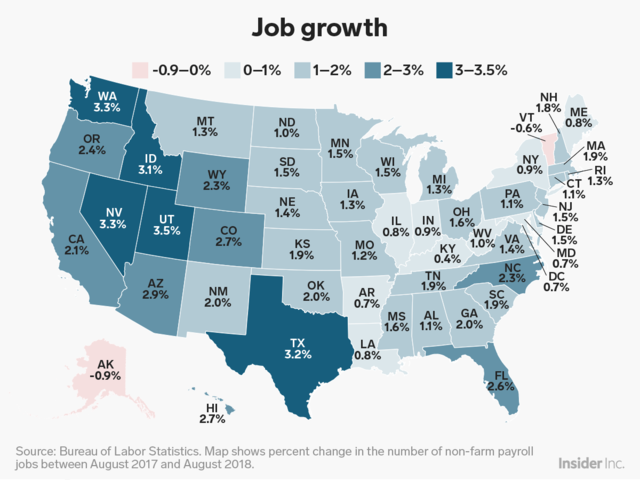
Non-farm payroll job growth between August 2017 and August 2018 ranged between -0.9% in Alaska to 3.5% in Utah.
Advertisement
Washington, DC's Q1 2018 GDP per capita of about $195,000 was the highest in the country, while Mississippi's $38,000 was the lowest.

GDP growth rates in the first quarter of this year ranged from North Dakota's -0.6% to Washington's 3.6%.

Advertisement
Washington, DC had the highest average weekly wage in August 2018 of $1,485, while Mississippi's $697 was the lowest.

Wage growth between August 2017 and August 2018 ranged from a low of -2.2% in Mississippi to a high of 9.2% in Wyoming.

Advertisement
 Next Story
Advertisement
 I spent 2 weeks in India. A highlight was visiting a small mountain town so beautiful it didn't seem real.
  I quit McKinsey after 1.5 years. I was making over $200k but my mental health was shattered.
 Some Tesla factory workers realized they were laid off when security scanned their badges and sent them back on shuttles, sources say
 A case for investing in Government securities
 Top places to visit in Auli in 2024
 Sustainable Transportation Alternatives
 Why are so many elite coaches moving to Western countries?
 Global GDP to face a 19% decline by 2050 due to climate change, study projects
