
Warren Buffett might be looking to buy these 12 stocks, Wells Fargo says


Altria


Ticker: MO
Industry: Tobacco
5-Year Average ROE: 139.8%
5-Year Average ROIC: 37.6%
D/E versus Industry D/E: 76.8% vs. 160.8%
5-year average pretax PM versus 5-year average industry PM: 57.8% vs. 30.0%
Current P/E versus Industry P/E: 12.1 vs. 13.9
Current P/B versus Industry P/B: 5.9 vs. 6.6
Current P/CF versus Industry P/CF: 12.5 vs. 33.4
Market Cap: $90.6 billion
Source: Wells Fargo
Cboe Global Markets

Ticker: CBOE
Industry: Financial exchanges
5-Year Average ROE: 61.3%
5-Year Average ROIC: 60.0%
D/E versus Industry D/E: 29.0% vs. 166.6%
5-year average pretax PM versus 5-year average industry PM: 42.5% vs. 34.4%
Current P/E versus Industry P/E: 19.0 vs. 23.2
Current P/B versus Industry P/B: 3.3 vs. 14.0
Current P/CF versus Industry P/CF: 20.5 vs. 20.8
Market Cap: $10.3 billion
Source: Wells Fargo
CNX Midstream Partners

Ticker: CNXM
Industry: Oil and gas
5-Year Average ROE: 22.0%
5-Year Average ROIC: 17.7%
D/E versus Industry D/E: 139.0% vs. 287.0%
5-year average pretax PM versus 5-year average industry PM: 52.2% vs. 24.1%
Current P/E versus Industry P/E: 9.7 vs. 18.8
Current P/B versus Industry P/B: 3.5 vs. 4.1
Current P/CF versus Industry P/CF: 6.4 vs. 7.3
Market Cap: $1.1 billion
Source: Wells Fargo
Cognizant Technology Solutions

Ticker: CTSH
Industry: Technology
5-Year Average ROE: 18.4%
5-Year Average ROIC: 16.8%
D/E versus Industry D/E: 5.7% vs. 108.2%
5-year average pretax PM versus 5-year average industry PM: 18.1% vs. 8.6%
Current P/E versus Industry P/E: 14.9 vs. 20.9
Current P/B versus Industry P/B: 3.4 vs. 4.3
Current P/CF versus Industry P/CF: 13.9 vs. 13.6
Market Cap: $37.4 billion
Source: Wells Fargo
Micron Technology

Ticker: MU
Industry: Semiconductors
5-Year Average ROE: 28.4%
5-Year Average ROIC: 19.0%
D/E versus Industry D/E: 11.0% vs. 84.7%
5-year average pretax PM versus 5-year average industry PM: 21.8% vs. 10.4%
Current P/E versus Industry P/E: 4.4 vs. 22.0
Current P/B versus Industry P/B: 1.1 vs. 5.9
Current P/CF versus Industry P/CF: 2.1 vs. 18.2
Market Cap: $38.9 billion
Source: Wells Fargo
Tapestry

Ticker: TPR
Industry: Luxury retail
5-Year Average ROE: 20.0%
5-Year Average ROIC: 16.2%
D/E versus Industry D/E: 48.4% vs. 62.4%
5-year average pretax PM versus 5-year average industry PM: 15.8% vs. 11.0%
Current P/E versus Industry P/E: 12.9 vs. 22.4
Current P/B versus Industry P/B: 3.2 vs. 5.0
Current P/CF versus Industry P/CF: 9.6 vs. 13.6
Market Cap: $10.5 billion
Source: Wells Fargo
Capri Holdings
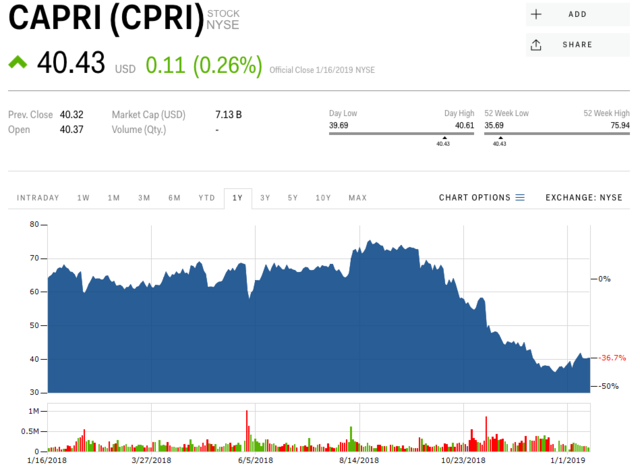
Ticker: CPRI
Industry: Apparel
5-Year Average ROE: 38.6%
5-Year Average ROIC: 37.0%
D/E versus Industry D/E: 23.1% vs. 62.4%
5-year average pretax PM versus 5-year average industry PM: 23.0% vs. 11.0%
Current P/E versus Industry P/E: 8.0 vs. 22.4
Current P/B versus Industry P/B: 2.8 vs. 5.0
Current P/CF versus Industry P/CF: 6.1 vs. 13.6
Market Cap: $6.1 billion
Source: Wells Fargo
Cummins

Industry: Diversified industrials
5-Year Average ROE: 19.0%
5-Year Average ROIC: 15.5%
D/E versus Industry D/E: 21.7% vs. 89.2%
5-year average pretax PM versus 5-year average industry PM: 11.6% vs. 9.1%
Current P/E versus Industry P/E: 10.3 vs. 13.7
Current P/B versus Industry P/B: 3.1 vs. 2.6
Current P/CF versus Industry P/CF: 10.5 vs. 19.3
Market Cap: $22.5 billion
Source: Wells Fargo
EQM Midstream Partners

Ticker: EQM
Industry: Oil and gas
5-Year Average ROE: 29.4%
5-Year Average ROIC: 18.5%
D/E versus Industry D/E: 68.8% vs. 287.0%
5-year average pretax PM versus 5-year average industry PM: 66.4% vs. 24.1%
Current P/E versus Industry P/E: 8.9 vs. 18.8
Current P/B versus Industry P/B: 1.1 vs. 4.1
Current P/CF versus Industry P/CF: 3.9 vs. 7.3
Market Cap: $5.3 billion
Source: Wells Fargo
Regeneron Pharmaceuticals

Ticker: REGN
Sector: Pharmaceuticals
5-Year Average ROE: 21.5%
5-Year Average ROIC: 18.3%
D/E versus Industry D/E: 9.0% vs. 52.0%
5-year average pretax PM versus 5-year average industry PM: 30.8% vs. 17.8%
Current P/E versus Industry P/E: 18.6 vs. 30.1
Current P/B versus Industry P/B: 5.5 vs. 5.7
Current P/CF versus Industry P/CF: 21.2 vs. 30.7
Market Cap: $42.6 billion
Source: Wells Fargo
Urban Outfitters

Ticker: URBN
Industry: Apparel
5-Year Average ROE: 15.6%
5-Year Average ROIC: 15.2%
D/E versus Industry D/E: 0.0% vs. 12.8%
5-year average pretax PM versus 5-year average industry PM: 10.3% vs. 6.8%
Current P/E versus Industry P/E: 11.9 vs. 14.5
Current P/B versus Industry P/B: 2.4 vs. 5.8
Current P/CF versus Industry P/CF: 8.7 vs. 8.3
Market Cap: $3.5 billion
Source: Wells Fargo
Bed Bath & Beyond

Ticker: BBBY
Industry: Specialty retail
5-Year Average ROE: 25.4%
5-Year Average ROIC: 18.6%
D/E versus Industry D/E: 51.4% vs. 477.5%
5-year average pretax PM versus 5-year average industry PM: 10.4% vs. 6.6%
Current P/E versus Industry P/E: 7.7 vs. 14.1
Current P/B versus Industry P/B: 0.7 vs. 16.1
Current P/CF versus Industry P/CF: 2.0 vs. 8.2
Market Cap: $2.1 billion
Source: Wells Fargo

 Next Story
 I spent $2,000 for 7 nights in a 179-square-foot room on one of the world's largest cruise ships. Take a look inside my cabin.
 Saudi Arabia wants China to help fund its struggling $500 billion Neom megaproject. Investors may not be too excited.
 Colon cancer rates are rising in young people. If you have two symptoms you should get a colonoscopy, a GI oncologist says.
 Markets extend gains for 5th session; Sensex revisits 74k
 Top 10 tourist places to visit in Darjeeling in 2024
 India's forex reserves sufficient to cover 11 months of projected imports
 ITC plans to open more hotels overseas: CMD Sanjiv Puri
 7 Indian dishes that are extremely rich in calcium
