Warren Buffett's favorite market indicator hits 200%, signaling stocks are overpriced and a crash may be coming
• Warren Buffett's preferred market gauge hit 200%, signaling stocks are overvalued.
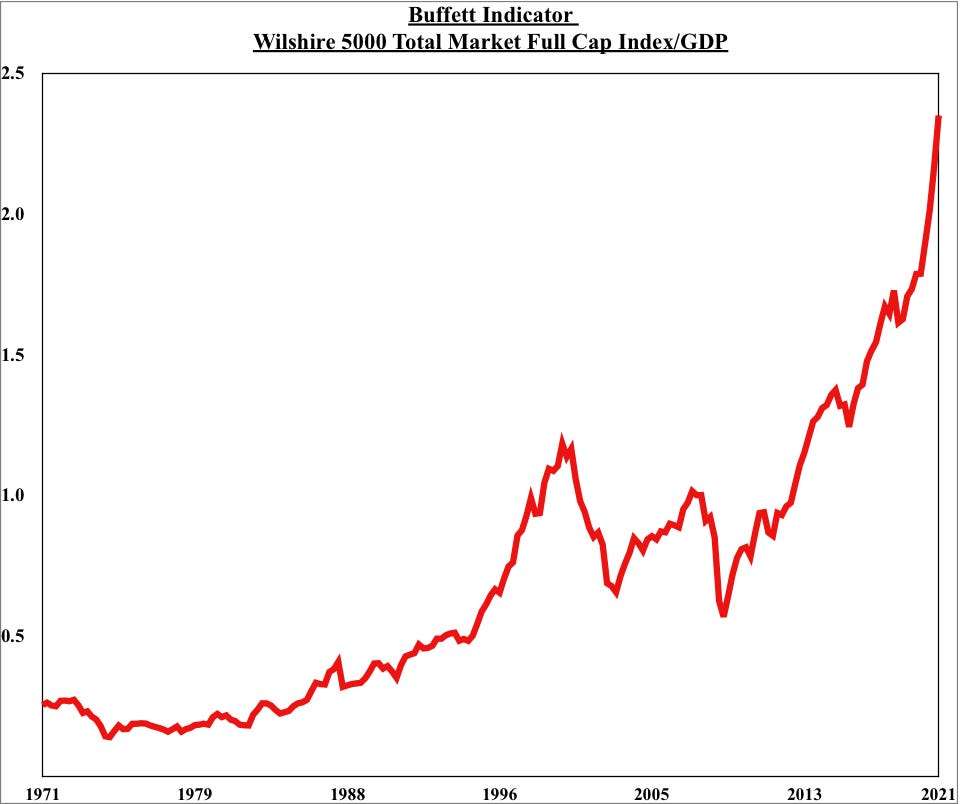
• The "Buffett indicator" compares the stock market's valuation to the size of the economy.
• Buffett said the gauge spiking is a "very strong warning signal" of a future market crash.
• See more stories on Insider's business page.
Warren Buffett's favorite market indicator hit 200% on Tuesday, signaling stocks are massively overpriced and a crash may be looming.
The "Buffett indicator" takes the combined market capitalization of all publicly traded US stocks, and divides it by the most recent quarterly figure for gross domestic product. Investors use it as a rough gauge of the stock market's valuation relative to the size of the economy.
The Wilshire 5000 Total Market Index climbed as high as $44.3 trillion on Tuesday, while the latest estimate for first-quarter GDP is $22.1 trillion, putting the Buffett indicator at 200%. That reading is well above the 187% it reached in the second quarter of 2020, when the pandemic was in full swing and GDP was about 12% lower.
Buffett trumpeted his namesake gauge in a Fortune magazine article in 2001, calling it "probably the best single measure of where valuations stand at any given moment."
The billionaire investor and Berkshire Hathaway CEO added that when the indicator hit a record high during the dot-com bubble, that should have been a "very strong warning signal" of the crash to come. The yardstick also spiked in the lead-up to the global financial crisis, making it a useful tool for anticipating market downturns.
However, the measure has its flaws. For example, it compares the stock market's current value to the previous quarter's GDP. Moreover, US-listed companies don't always contribute to the American economy, and GDP ignores overseas income.
The pandemic has also disrupted economic activity and depressed GDP since last spring, inflating the Buffett indicator's readings. The gauge may well retreat from record levels if the economic reopening juices GDP this quarter.
Here's the St Louis Fed's version of the Buffett indicator (both market cap and GDP are indexed to the fourth quarter of 2007):