
6 maps showing the unemployment rate, GDP, and wage growth in every state paint a clear picture of the American economy right now
Advertisement

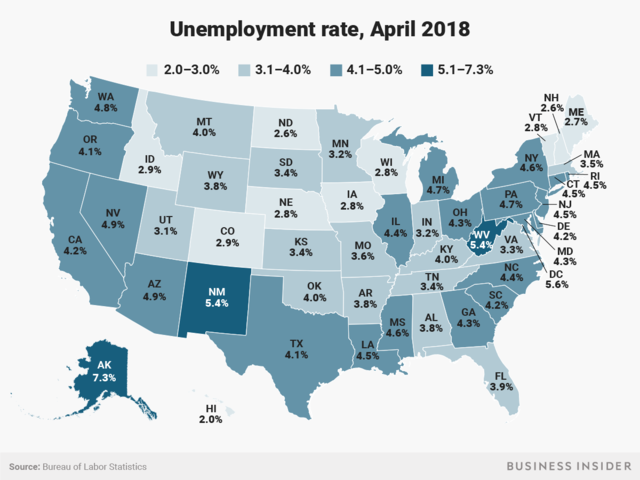
Hawaii had the lowest April 2018 unemployment rate of 2.0%, while Alaska's 7.3% rate was the highest.

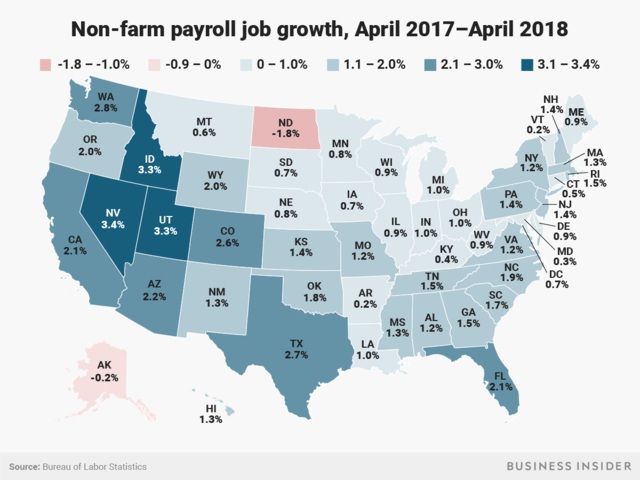
Non-farm payroll job growth rates between April 2017 and April 2018 ranged from North Dakota's 1.8% decline to Nevada's 3.4% increase.
Advertisement
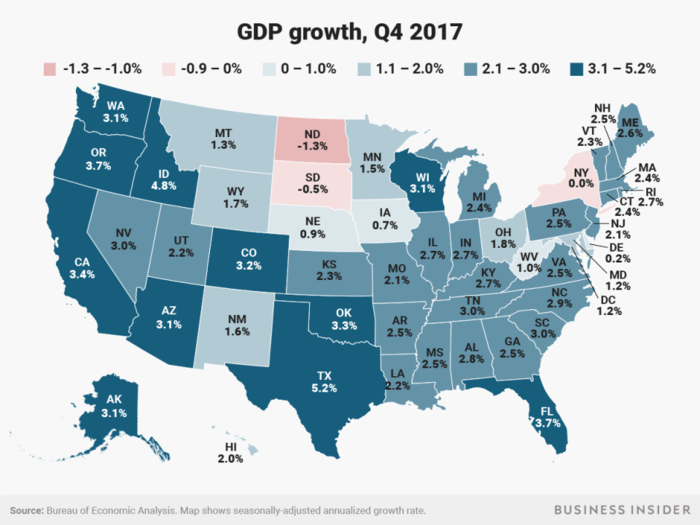
North Dakota's state gross domestic product (GDP) fell 1.3% at an annualized rate in Q4 2017, while Texas' grew 5.2%.

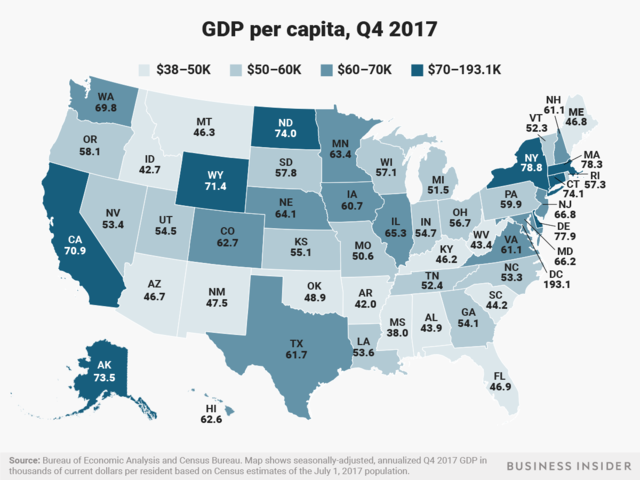
Mississippi had the lowest Q4 2017 GDP per capita at about $38,000, while the District of Columbia's GDP per capita was a whopping $193,000.
Advertisement
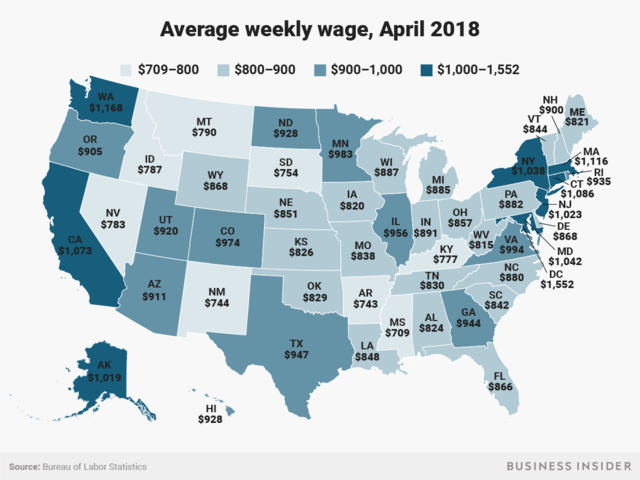
Mississippi also had the lowest April 2018 average weekly wage among the states and DC, at $709, and the District of Columbia also had the highest wage at $1,552.
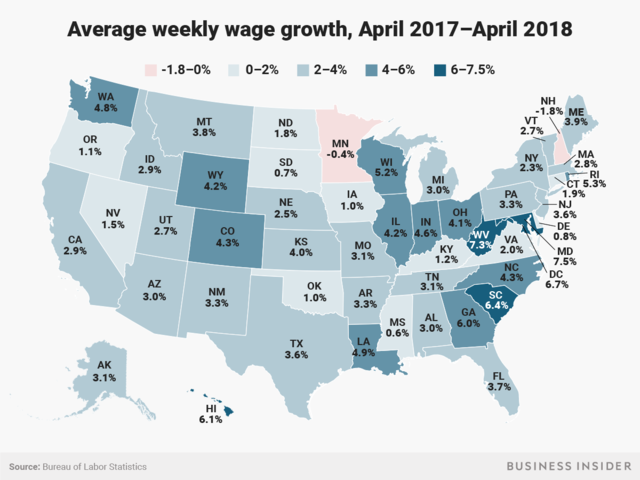
Wage growth between April 2017 and April 2018 ranged from New Hampshire's 1.8% decline to Maryland's 7.5% increase.
Advertisement
 Next Story
Advertisement
 US buys 81 Soviet-era combat aircraft from Russia's ally costing on average less than $20,000 each, report says
 2 states where home prices are falling because there are too many houses and not enough buyers
 A couple accidentally shipped their cat in an Amazon return package. It arrived safely 6 days later, hundreds of miles away.
 10 benefits of incorporating almond oil into your daily diet
 From heart health to detoxification: 10 reasons to eat beetroot
 Why did a NASA spacecraft suddenly start talking gibberish after more than 45 years of operation? What fixed it?
 ICICI Bank shares climb nearly 5% after Q4 earnings; mcap soars by ₹36,555.4 crore
 Markets rebound sharply on buying in bank stocks firm global trends
