I'm a travel reporter who's barely left home in 9 months, but Google Maps’ new tool makes me feel safer about traveling again
- Google Maps' new "COVID-19 layer" allows users to see up-to-date coronavirus risk numbers.
- It shows a seven-day average of the number of new cases per 100,000 people.
- Stats are based on The New York Times, Wikipedia, Johns Hopkins University, and the Brihanmumbai Municipal Corporation.
- This feature, along with others such as "live busyness" and transit alerts, will help make traveling during the pandemic a little safer.
- The Centers for Disease Control and Prevention warns that "travel increases your chance of getting and spreading COVID-19."
As a Google Pixel phone owner who sings its praises from the rooftops, I'm already very aware of how Google products help me, both when I travel and in my day-to-day life.
However, Google Maps recently unveiled a new feature that can help us all be a little safer during this pandemic - especially as the holidays approach and many will travel to see family, despite the Centers for Disease Control and Prevention's recommendation that people stay home.
As a travel reporter who has barely left her hometown in nine months, and is planning to drive 33 hours to Colorado for the winter soon, this new feature, called the "COVID-19 layer," makes me feel a little bit more in control.
The new "COVID-19 layer" allows users to see up-to-date coronavirus risk numbers, as well as whether the number of cases is going up or down.
It shows a seven-day average of the number of new cases per 100,000 people.
According to Google, the stats are based on The New York Times, Wikipedia, Johns Hopkins University, and the Brihanmumbai Municipal Corporation.
To get to this layer, open Google Maps and click on the layers icon on the top right, which looks like two little squares on top of each other. Then click on "COVID-19 info."
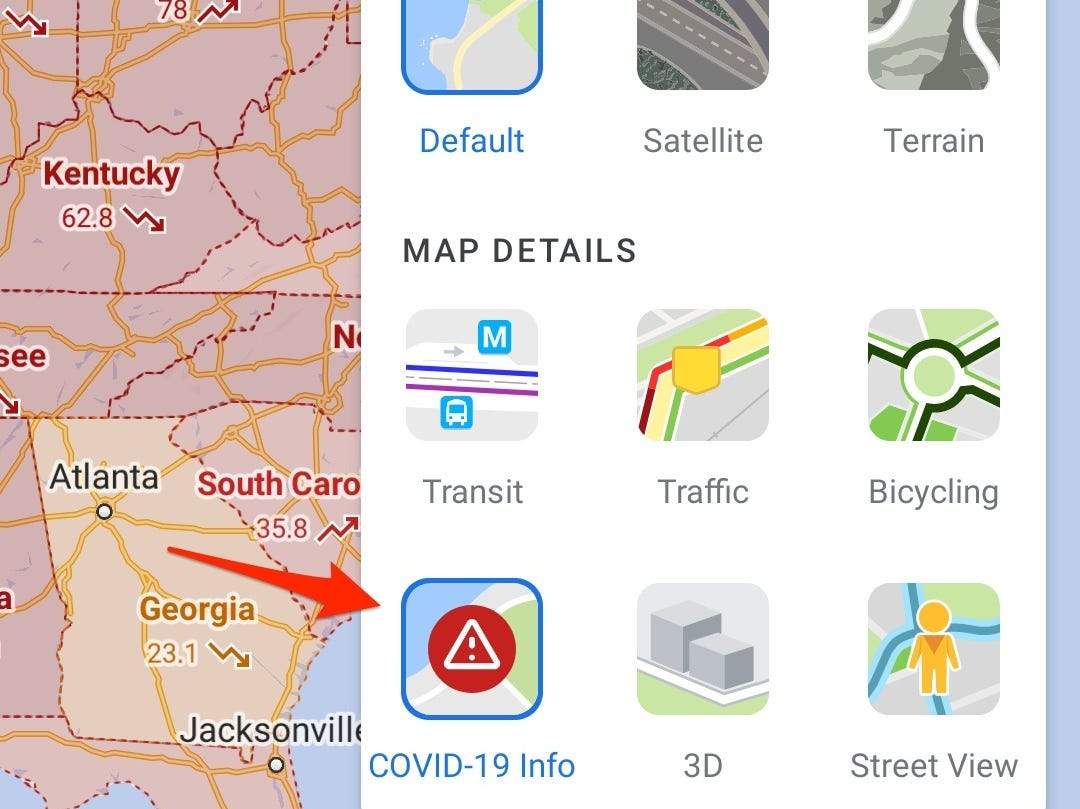
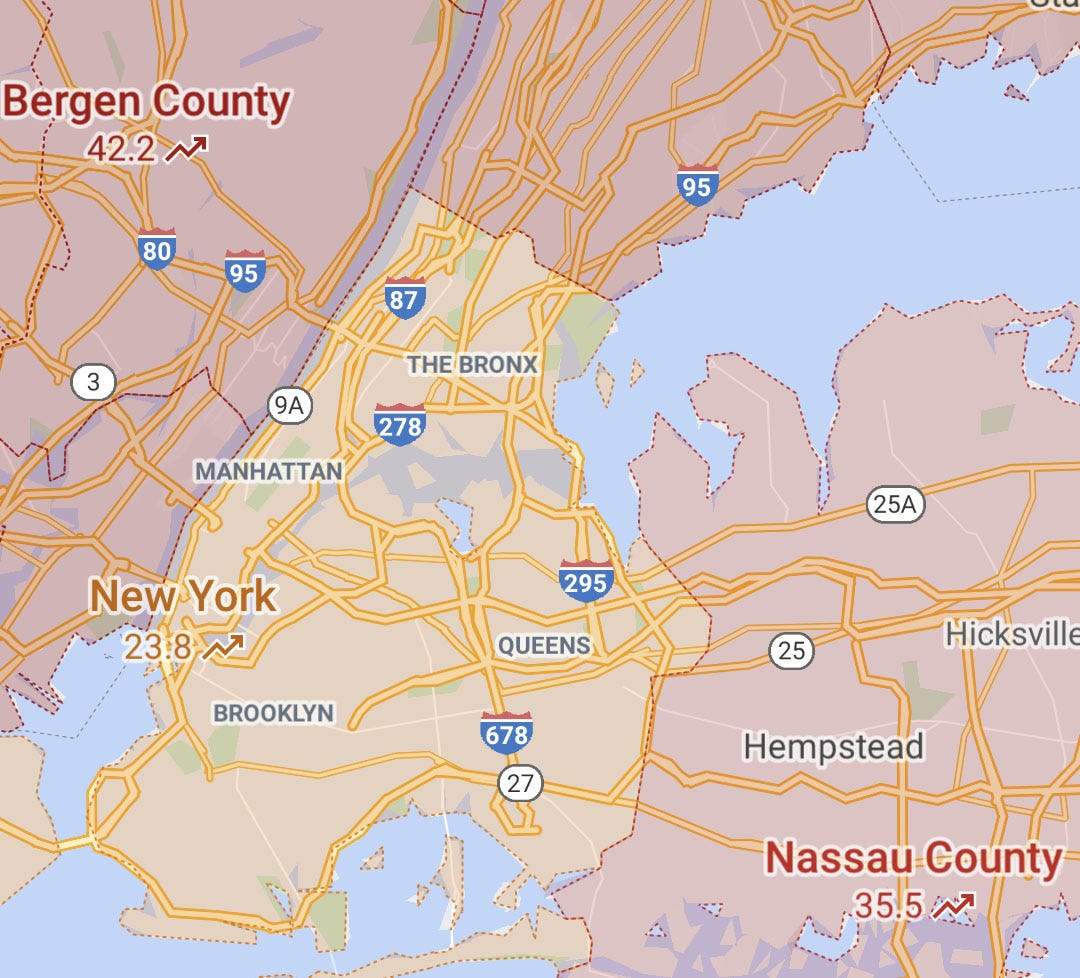
You then probably need to zoom out a little bit as the info is by county, state, and country. The map is color-coded, ranging from gray (less than one case per 100,000 people) to dark red (40+ cases per 100,000 people).
Looking at the map will help you see whether there are any outbreaks in your area - I find this particularly useful given the anticipated post-Thanksgiving spike.
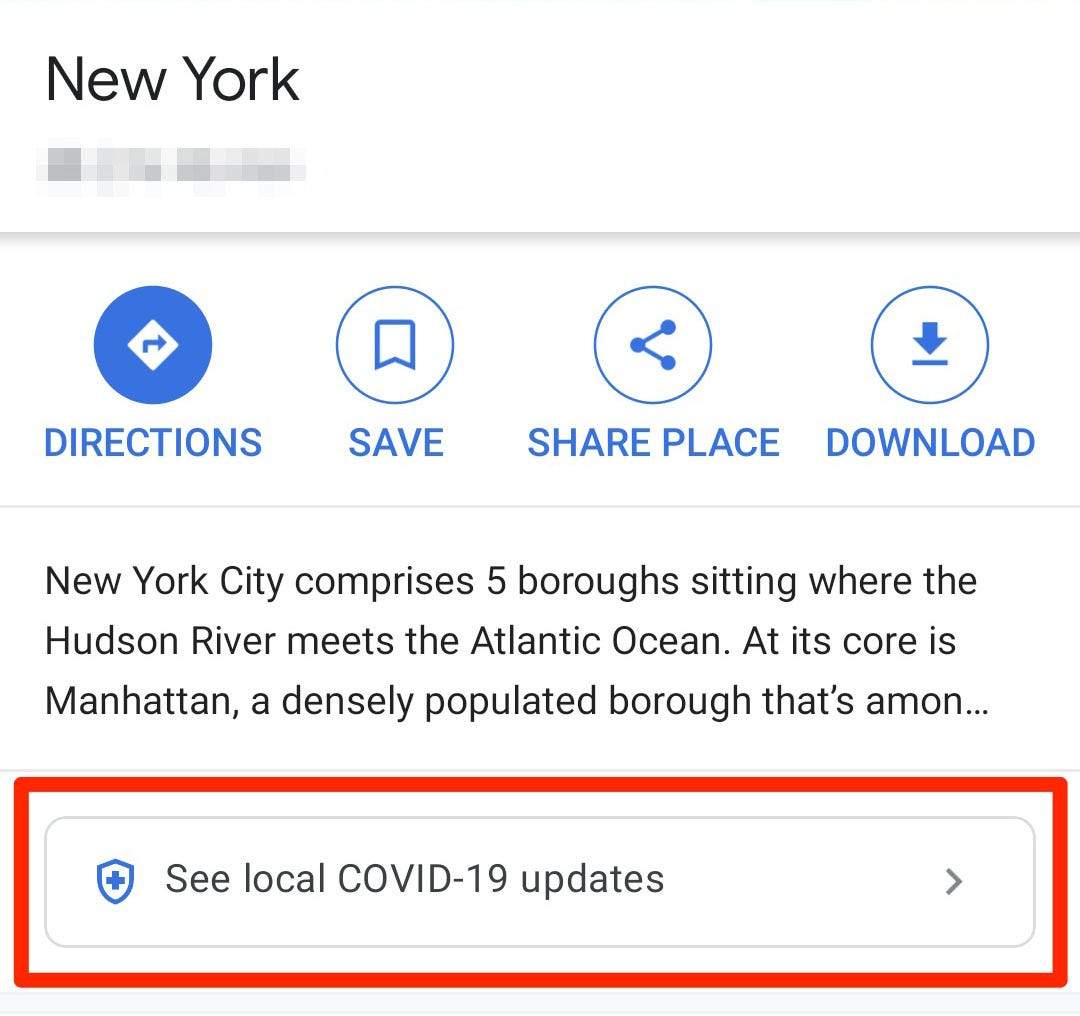
It can also help inform any trips you have planned, as you can see if cases are rising at your destination. Clicking on a place will also take you to local coronavirus resources.
Google has also rolled out other helpful coronavirus-related features, including "live busyness" information for public transportation, restaurants, and shops, as well as providing any COVID-19 updates these may have or precautions they have put in place, as well as transit alerts and COVID-19 restrictions for routes you look up.
It is worth noting that the Centers for Disease Control and Prevention warns that "travel increases your chance of getting and spreading COVID-19."
This is an opinion column. The thoughts expressed are those of the author(s).