
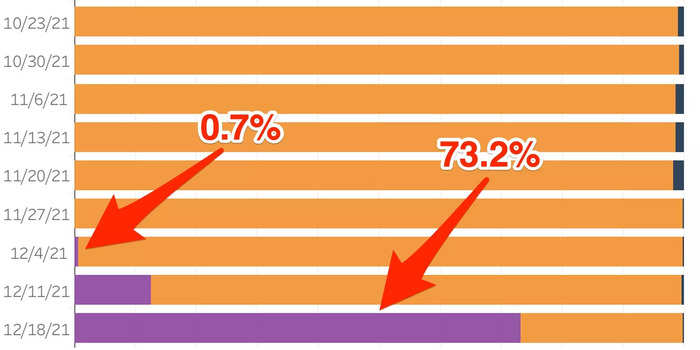
CDC chart shows how Omicron went from 0.7% to 73% of US COVID-19 cases in just 2 weeks
Advertisement

 Next Story
Advertisement
 Markets trade on firm note in last part of special trading session
 Markets settle marginally higher in first part of special trading session
 Can you name these new space trash constellations? 10 new signs highlight consequences of space garbage
 MI skipper Hardik Pandya fined for maintaining slow over-rate, to miss first game of IPL 2025 season
 OYO withdraws DRHP, to refile IPO post refinancing: Sources
