
The 15 US cities where it's hardest to get a mortgage, ranked


15. Louisville, Kentucky


Overall denial rate: 7.7%
Top denial reason: Credit history
14. New Orleans, Louisiana

Overall denial rate: 7.8%
Top denial reason: Debt-to-income ratio
13. Riverside, California

Overall denial rate: 8.0%
Top denial reason: Debt-to-income ratio
12. Atlanta, Georgia
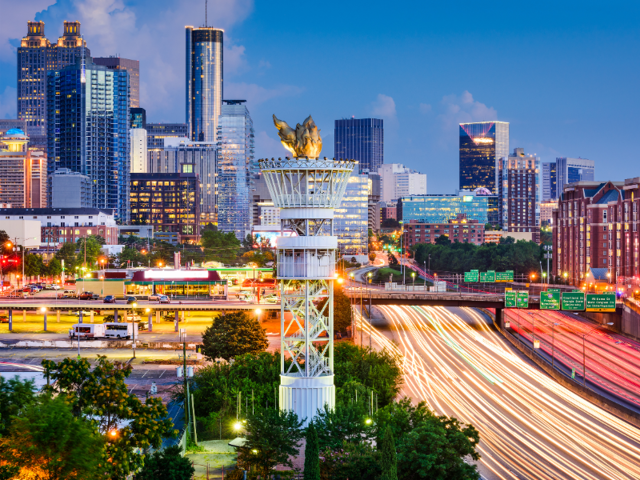
Overall denial rate: 8.2%
Top denial reason: Debt-to-income ratio
11. Los Angeles, California

Overall denial rate: 8.3%
Top denial reason: Debt-to-income ratio
10. San Antonio, Texas
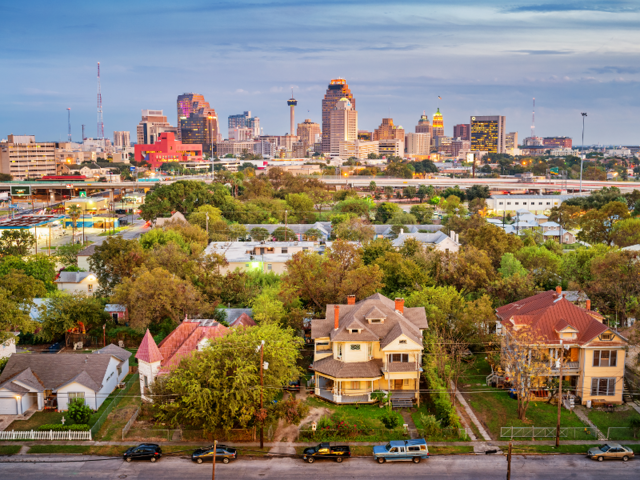
Overall denial rate: 8.4%
Top denial reason: Debt-to-income ratio
9. New York, New York

Overall denial rate: 8.5%
Top denial reason: Debt-to-income ratio
T8. San Jose, California

Overall denial rate: 8.7%
Top denial reason: Debt-to-income ratio
T8. Houston, Texas
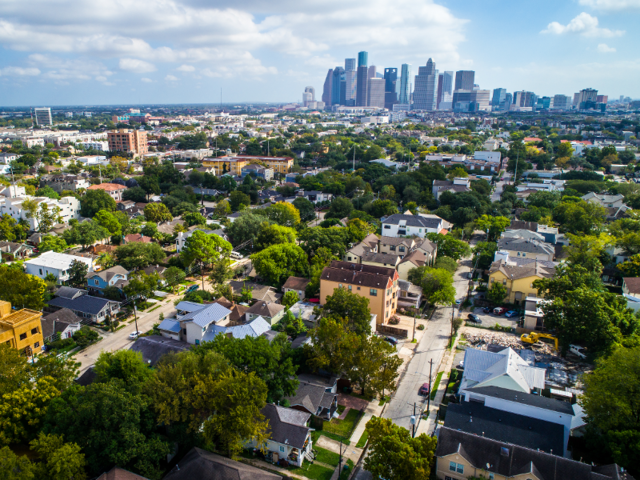
Overall denial rate: 8.7%
Top denial reason: Debt-to-income ratio
6. Birmingham, Alabama
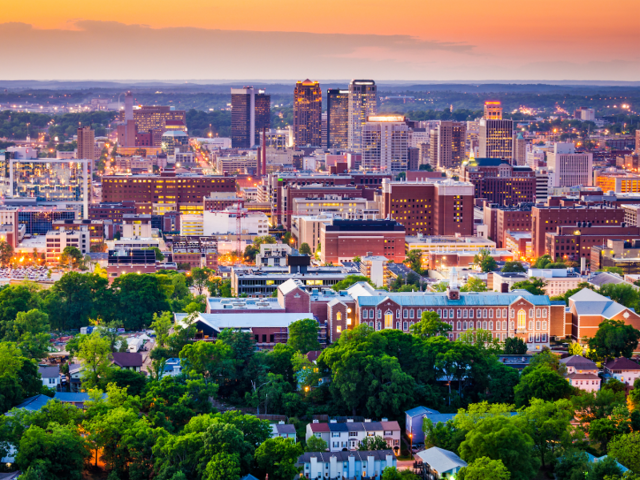
Overall denial rate: 8.8%
Top denial reason: Credit history
5. Detroit, Michigan
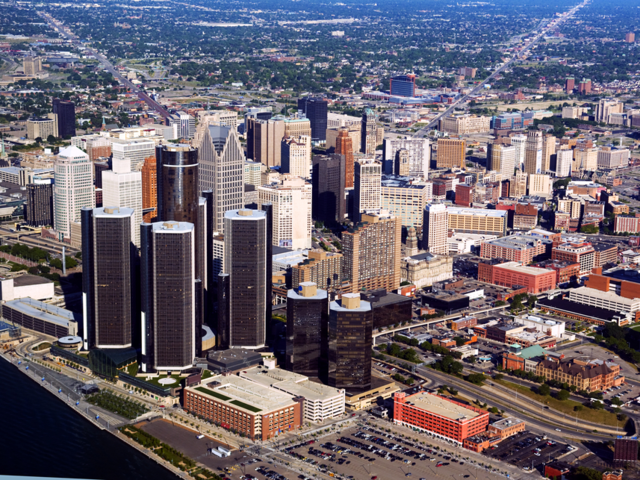
Overall denial rate: 9.4%
Top denial reason: Debt-to-income ratio
T4. Jacksonville, Florida

Overall denial rate: 9.5%
Top denial reason: Debt-to-income ratio
T4. Tampa, Florida
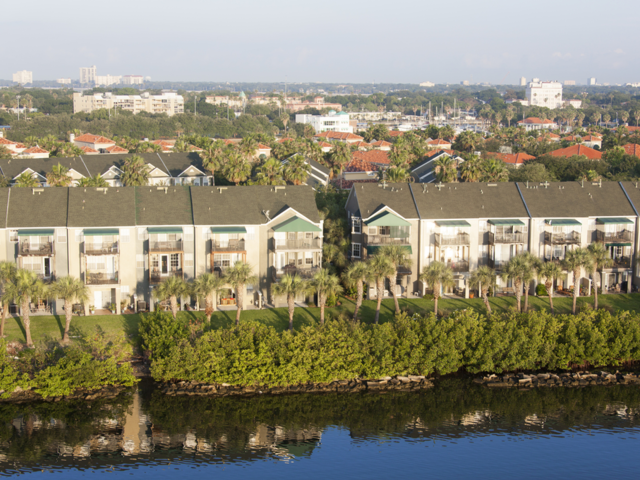
Overall denial rate: 9.5%
Top denial reason: Debt-to-income ratio
2. Orlando, Florida

Overall denial rate: 10.9%
Top denial reason: Debt-to-income ratio
1. Miami, Florida

Overall denial rate: 11.6%
Top denial reason: Debt-to-income ratio
 Next Story


 Global stocks rally even as Sensex, Nifty fall sharply on Friday
 In second consecutive week of decline, forex kitty drops $2.28 bn to $640.33 bn
 SBI Life Q4 profit rises 4% to ₹811 crore
 IMD predicts severe heatwave conditions over East, South Peninsular India for next five days
 COVID lockdown-related school disruptions will continue to worsen students’ exam results into the 2030s: study
- JNK India IPO allotment date
- JioCinema New Plans
- Realme Narzo 70 Launched
- Apple Let Loose event
- Elon Musk Apology
- RIL cash flows
- Charlie Munger
- Feedbank IPO allotment
- Tata IPO allotment
- Most generous retirement plans
- Broadcom lays off
- Cibil Score vs Cibil Report
- Birla and Bajaj in top Richest
- Nestle Sept 2023 report
- India Equity Market
