As tragic as it is, to reinforce prompt action, the problem must be readily observable. This is why we observed a tremendous boost in plastic eradication efforts after dismal videos of turtles and fish tangled up in the stuff surfaced online. And sadly enough, this is the same reason it is challenging to affirm robust climate action.
Advertisement
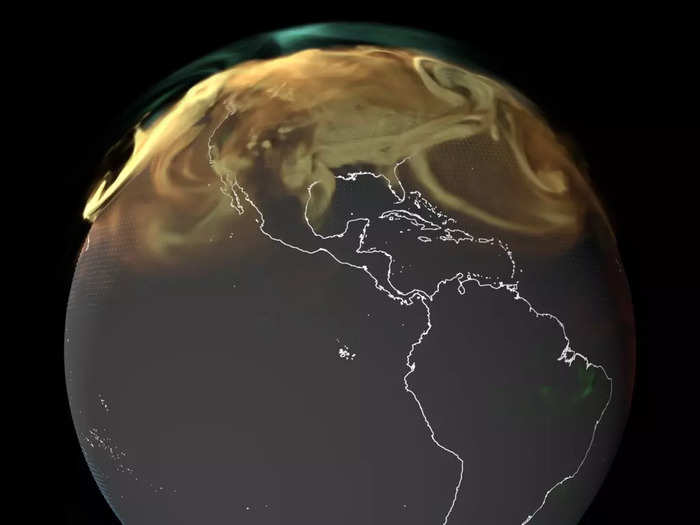
In addition, we rarely see repercussions till hopelessly late. To avert such crises, experts rely on many visualisation techniques to communicate the full extent of the problems. A new set of videos by NASA has attempted exactly this, helping viewers grasp the flux of carbon emissions over the Earth.
Despite making up only 0.04% of our atmosphere, carbon dioxide is the textbook bad apple, one of the primary culprits behind global warming.
While the gases disappear after emerging from industrial smokestacks and engine exhausts, they're simply dispersing stealthily into the atmosphere, like silent assassins among the masses.
From here, they travel the planet, either to be absorbed naturally by forests and oceans, or doomed to roam the world's airstreams. However, this movement can differ extensively based on the time of the year.
Advertisement
In three videos, NASA expresses the voyage of carbon dioxide from source to sink over the course of 2021.
The colour of the gases is colour-coded based on their main contributors: fossil fuels in orange, burning biomass in red, land ecosystems in green, and the ocean in blue. Green and blue dots represent areas where atmospheric CO2 is being absorbed by land ecosystems and the sea, respectively.
As is evident, the primary source of atmospheric CO2 comprises fossil fuels. Most of the emissions begin in the northern hemisphere and gradually gust into the rest of the planet as the year progresses.
A major reason for such thick emissions in the later months is that plants absorb CO2 in their growing months and release the gas through respiration in winter, typically in the latter half for most developed countries such as the US and Europe.
Advertisement
A tremendous amount of CO2 can be seen oozing out of China, which consistently continues to be the largest greenhouse gas emitter year after year. Even India emits much of the stuff, as seen in the video.
While Australia mostly sequesters CO2 due to the region's relatively low population density, emissions from the northern hemisphere quickly spill over into this area, eventually obscuring the entire continent by the end of the year.
Overall, the videos depict quite horrifyingly the extent to which industrialised countries add to emissions worldwide. The graphic also notes how far the danger compound travels to terrorise other, often more vulnerable, populations.
In three videos, NASA expresses the voyage of carbon dioxide from source to sink over the course of 2021. The primary source of atmospheric CO2 comprises fossil fuels. Most of the emissions begin in the northern hemisphere and gradually gust into the rest of the planet as the year progresses.
NewsletterSIMPLY PUT - where we join the dots to inform and inspire you. Sign up for a weekly brief collating many news items into one untangled thought delivered straight to your mailbox.


 Next Story
 A couple accidentally shipped their cat in an Amazon return package. It arrived safely 6 days later, hundreds of miles away.
 A centenarian who starts her day with gentle exercise and loves walks shares 5 longevity tips, including staying single
  2 states where home prices are falling because there are too many houses and not enough buyers
 "To sit and talk in the box...!" Kohli's message to critics as RCB wrecks GT in IPL Match 45
 7 Nutritious and flavourful tiffin ideas to pack for school
 India's e-commerce market set to skyrocket as the country's digital economy surges to USD 1 Trillion by 2030
 Top 5 places to visit near Rishikesh
 Indian economy remains in bright spot: Ministry of Finance
